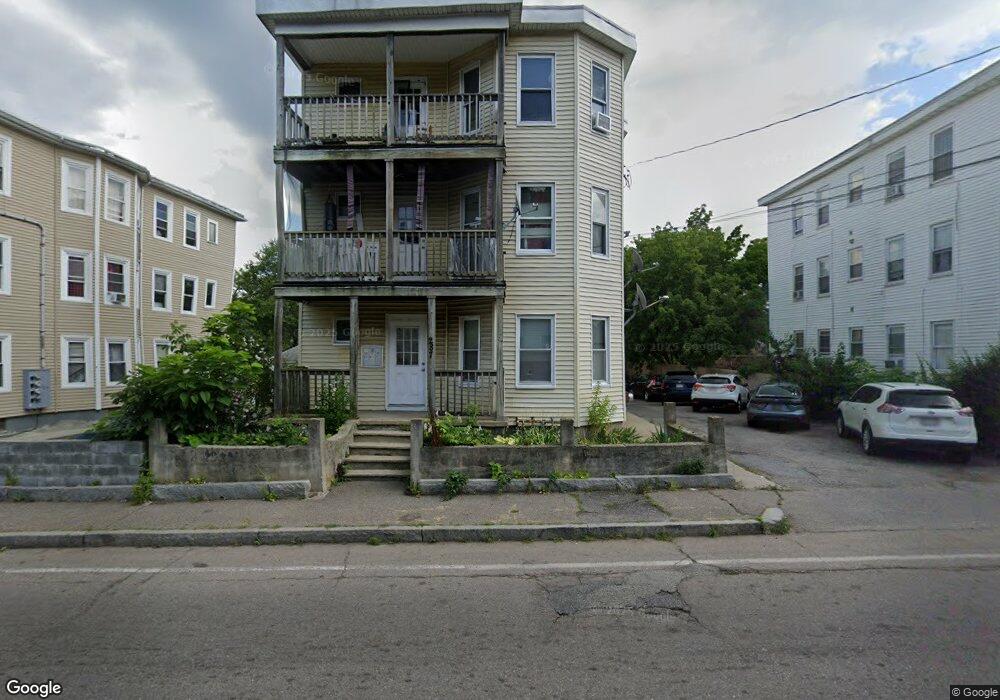
287 Grove St Brockton, MA 02302
Estimated Value: $748,000 - $1,519,321
7
Beds
3
Baths
3,813
Sq Ft
$285/Sq Ft
Est. Value
About This Home
This home is located at 287 Grove St, Brockton, MA 02302 and is currently estimated at $1,088,080, approximately $285 per square foot. 287 Grove St is a home located in Plymouth County with nearby schools including Brookfield Elementary School, Downey Elementary School, and Mary E. Baker Elementary School.
Ownership History
Date
Name
Owned For
Owner Type
Purchase Details
Closed on
Apr 21, 2022
Sold by
Delcon Enterprises Llc
Bought by
Trifone Family Lp
Current Estimated Value
Purchase Details
Closed on
Sep 30, 2021
Sold by
J S Barry Development Llc
Bought by
Delcon Enterprises Llc
Home Financials for this Owner
Home Financials are based on the most recent Mortgage that was taken out on this home.
Original Mortgage
$130,000
Interest Rate
2.8%
Mortgage Type
Commercial
Purchase Details
Closed on
Apr 29, 2019
Sold by
Jemela Rt
Bought by
Jemelita Rt
Create a Home Valuation Report for This Property
The Home Valuation Report is an in-depth analysis detailing your home's value as well as a comparison with similar homes in the area
Home Values in the Area
Average Home Value in this Area
Purchase History
| Date | Buyer | Sale Price | Title Company |
|---|---|---|---|
| Trifone Family Lp | $400,000 | None Available | |
| Delcon Enterprises Llc | $350,000 | None Available | |
| Jemelita Rt | -- | -- |
Source: Public Records
Mortgage History
| Date | Status | Borrower | Loan Amount |
|---|---|---|---|
| Previous Owner | Delcon Enterprises Llc | $130,000 |
Source: Public Records
Tax History Compared to Growth
Tax History
| Year | Tax Paid | Tax Assessment Tax Assessment Total Assessment is a certain percentage of the fair market value that is determined by local assessors to be the total taxable value of land and additions on the property. | Land | Improvement |
|---|---|---|---|---|
| 2025 | $7,679 | $634,100 | $140,100 | $494,000 |
| 2024 | $7,663 | $637,500 | $140,100 | $497,400 |
| 2023 | $6,547 | $504,400 | $104,500 | $399,900 |
| 2022 | $6,412 | $459,000 | $95,000 | $364,000 |
| 2021 | $6,010 | $414,500 | $78,900 | $335,600 |
| 2020 | $5,763 | $380,400 | $73,900 | $306,500 |
| 2019 | $5,335 | $343,300 | $72,100 | $271,200 |
| 2018 | $4,698 | $292,500 | $72,100 | $220,400 |
| 2017 | $4,481 | $278,300 | $72,100 | $206,200 |
| 2016 | $3,998 | $230,300 | $69,900 | $160,400 |
| 2015 | $2,953 | $162,700 | $69,900 | $92,800 |
| 2014 | $2,903 | $160,100 | $69,900 | $90,200 |
Source: Public Records
Map
Nearby Homes