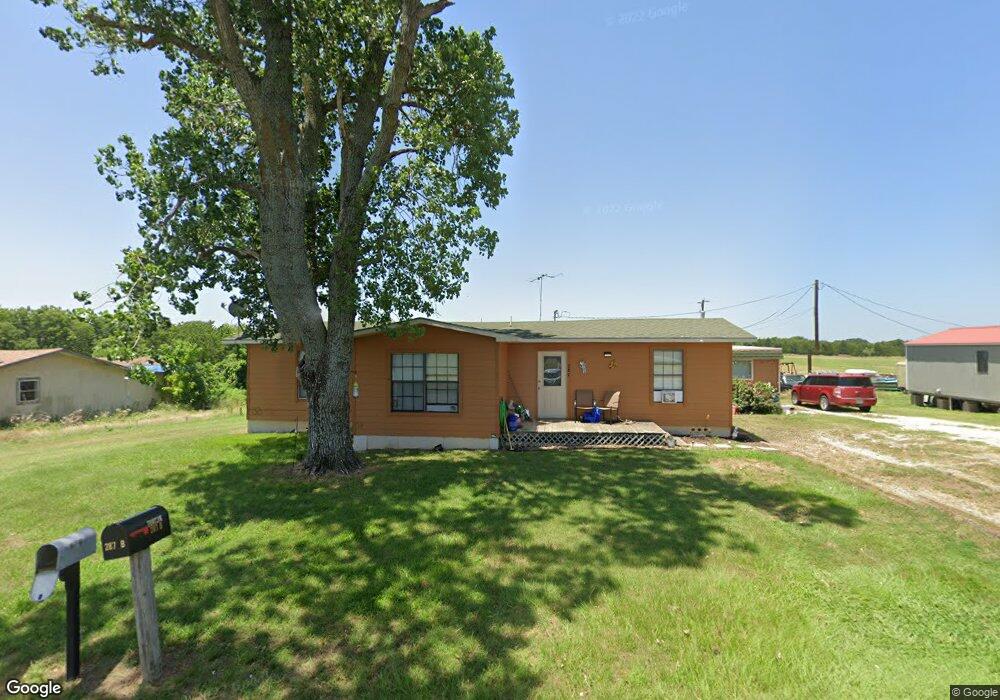
287 Kyker Ln Unit 287B Pottsboro, TX 75076
Estimated Value: $323,000
--
Bed
--
Bath
2,073
Sq Ft
$156/Sq Ft
Est. Value
About This Home
This home is located at 287 Kyker Ln Unit 287B, Pottsboro, TX 75076 and is currently estimated at $323,000, approximately $155 per square foot. 287 Kyker Ln Unit 287B is a home located in Grayson County with nearby schools including Pottsboro Elementary School, Pottsboro Middle School, and Pottsboro High School.
Create a Home Valuation Report for This Property
The Home Valuation Report is an in-depth analysis detailing your home's value as well as a comparison with similar homes in the area
Home Values in the Area
Average Home Value in this Area
Tax History Compared to Growth
Tax History
| Year | Tax Paid | Tax Assessment Tax Assessment Total Assessment is a certain percentage of the fair market value that is determined by local assessors to be the total taxable value of land and additions on the property. | Land | Improvement |
|---|---|---|---|---|
| 2025 | $1,947 | $146,080 | $38,298 | $107,782 |
| 2024 | $1,947 | $140,516 | $33,580 | $106,936 |
| 2023 | $2,123 | $152,966 | $31,200 | $121,766 |
| 2022 | $1,649 | $104,771 | $23,400 | $81,371 |
| 2021 | $1,565 | $96,235 | $19,500 | $76,735 |
| 2020 | $1,490 | $88,270 | $9,750 | $78,520 |
| 2019 | $1,179 | $66,636 | $9,750 | $56,886 |
| 2018 | $1,193 | $66,606 | $9,750 | $56,856 |
| 2017 | $1,075 | $59,237 | $6,435 | $52,802 |
| 2016 | $1,052 | $57,979 | $5,460 | $52,519 |
| 2015 | $0 | $50,049 | $5,460 | $44,589 |
| 2014 | -- | $49,419 | $5,460 | $43,959 |
Source: Public Records
Map
Nearby Homes
- 0000 Reeves Rd
- TBD Hagerman Rd
- Lot 48 Spout Springs Rd
- 104 Chisolm Trail
- 109 Chisolm Trail
- 000 Loving Trail
- 121 Shawnee Trail
- 117 Chisolm Trail
- 124 Chisolm Trail
- 129 Chisolm Trail
- 100 Chisolm Trail
- 125 Shawnee Trail
- 144 Shawnee Trail
- 1050 Cooks Corner Rd
- 283 Cooks Corner Rd
- 133 S Meadowbrook Dr
- 297 Cemetery Rd
- 20 AC Preston Bend Rd
- 49 AC Preston Bend Rd
- 3.269 Ac Sh 289