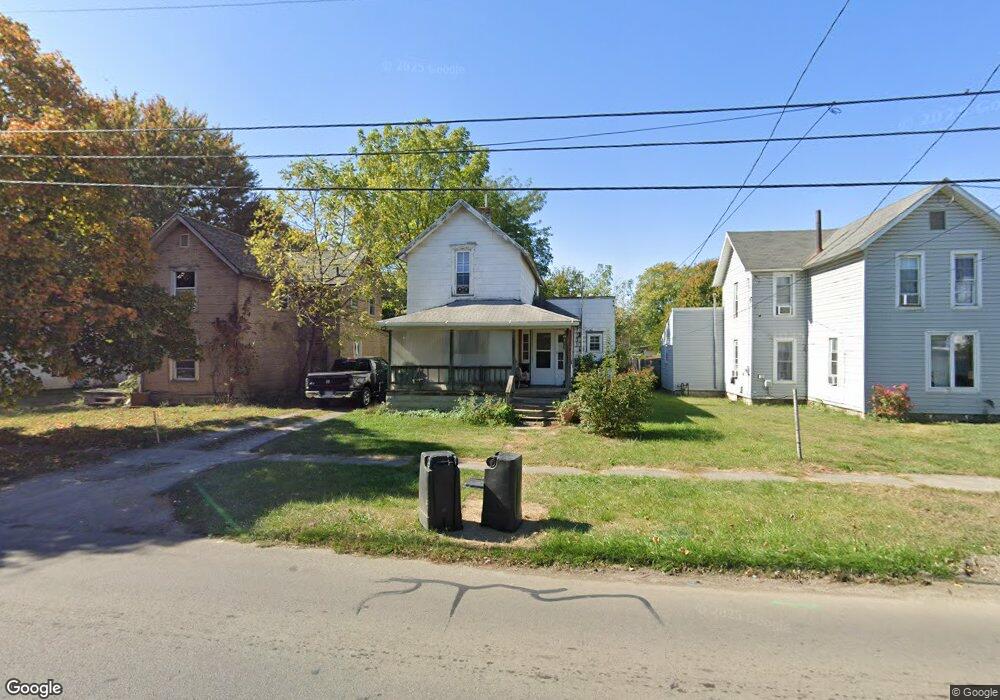
287 Leader St Marion, OH 43302
Estimated Value: $65,000 - $129,000
2
Beds
1
Bath
1,288
Sq Ft
$70/Sq Ft
Est. Value
About This Home
This home is located at 287 Leader St, Marion, OH 43302 and is currently estimated at $90,698, approximately $70 per square foot. 287 Leader St is a home located in Marion County with nearby schools including James A. Garfield Elementary School, Ulysses S. Grant Middle School, and Harding High School.
Ownership History
Date
Name
Owned For
Owner Type
Purchase Details
Closed on
Sep 30, 2004
Sold by
Citibank Na
Bought by
Linacre Llc
Current Estimated Value
Purchase Details
Closed on
Sep 16, 2004
Sold by
Huggins Doreena J and Huggins Doreena
Bought by
Citibank Na
Purchase Details
Closed on
Sep 29, 1999
Bought by
Linacre Llc
Purchase Details
Closed on
Jan 23, 1998
Bought by
Linacre Llc
Purchase Details
Closed on
Apr 11, 1997
Bought by
Linacre Llc
Create a Home Valuation Report for This Property
The Home Valuation Report is an in-depth analysis detailing your home's value as well as a comparison with similar homes in the area
Home Values in the Area
Average Home Value in this Area
Purchase History
| Date | Buyer | Sale Price | Title Company |
|---|---|---|---|
| Linacre Llc | $20,500 | Chicago Title | |
| Citibank Na | $18,000 | Chicago Title | |
| Linacre Llc | -- | -- | |
| Linacre Llc | $20,000 | -- | |
| Linacre Llc | $17,000 | -- |
Source: Public Records
Tax History
| Year | Tax Paid | Tax Assessment Tax Assessment Total Assessment is a certain percentage of the fair market value that is determined by local assessors to be the total taxable value of land and additions on the property. | Land | Improvement |
|---|---|---|---|---|
| 2025 | $893 | $13,740 | $1,800 | $11,940 |
| 2024 | $893 | $16,900 | $1,730 | $15,170 |
| 2023 | $893 | $16,900 | $1,730 | $15,170 |
| 2022 | $950 | $16,900 | $1,730 | $15,170 |
| 2021 | $523 | $13,180 | $1,510 | $11,670 |
| 2020 | $524 | $13,180 | $1,510 | $11,670 |
| 2019 | $609 | $13,180 | $1,510 | $11,670 |
| 2018 | $590 | $11,940 | $1,470 | $10,470 |
| 2017 | $608 | $12,430 | $1,470 | $10,960 |
| 2016 | $496 | $12,430 | $1,470 | $10,960 |
| 2015 | $496 | $12,160 | $1,400 | $10,760 |
| 2014 | $498 | $12,160 | $1,400 | $10,760 |
| 2012 | $591 | $14,370 | $1,480 | $12,890 |
Source: Public Records
Map
Nearby Homes
- 343 Commercial St
- 384 Mary St
- 233 Tully St
- 230 Edwards St
- 389 Oak St
- 138 Park Blvd
- 324 W Church St
- 187 Olney Ave
- 199 Olney Ave
- 438 N Prospect St Unit 434
- 245 Park Blvd
- 374 Nunin Ct
- 408 Scranton Ave
- 641 Blake Ave
- 532 N Prospect St
- 805 Silver St
- 414 Thompson St
- 552 N Prospect St
- 531 N Main St
- 302 Blaine Ave
Your Personal Tour Guide
Ask me questions while you tour the home.