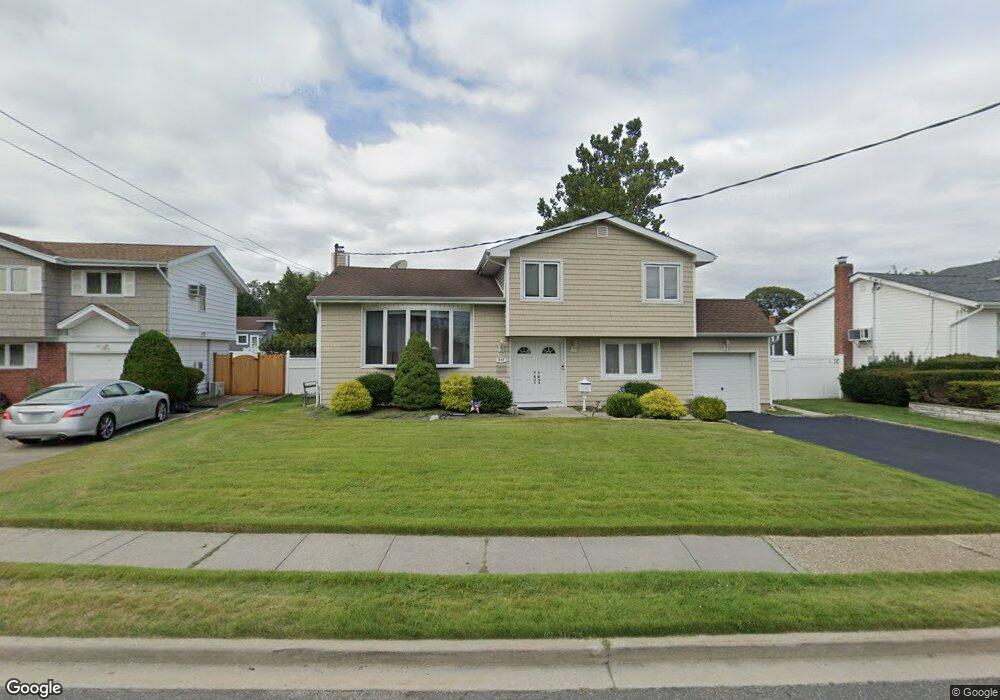
287 Linden St Massapequa Park, NY 11762
Estimated Value: $760,000 - $787,774
4
Beds
2
Baths
1,093
Sq Ft
$708/Sq Ft
Est. Value
About This Home
This home is located at 287 Linden St, Massapequa Park, NY 11762 and is currently estimated at $773,887, approximately $708 per square foot. 287 Linden St is a home located in Nassau County with nearby schools including Albany Avenue Elementary School, Weldon E. Howitt Middle School, and Farmingdale Senior High School.
Ownership History
Date
Name
Owned For
Owner Type
Purchase Details
Closed on
Jun 6, 2018
Sold by
Salgine Michael and Salgine Dawn
Bought by
Schillero Joseph and Schillero Valerie
Current Estimated Value
Home Financials for this Owner
Home Financials are based on the most recent Mortgage that was taken out on this home.
Original Mortgage
$300,000
Outstanding Balance
$259,450
Interest Rate
4.5%
Mortgage Type
New Conventional
Estimated Equity
$514,437
Purchase Details
Closed on
Jul 1, 2008
Sold by
Casimir John
Bought by
Salgine Michael
Purchase Details
Closed on
Dec 20, 2007
Sold by
Triolo Andrew E
Bought by
Casimir John
Create a Home Valuation Report for This Property
The Home Valuation Report is an in-depth analysis detailing your home's value as well as a comparison with similar homes in the area
Home Values in the Area
Average Home Value in this Area
Purchase History
| Date | Buyer | Sale Price | Title Company |
|---|---|---|---|
| Schillero Joseph | $532,500 | Fidelity National Title | |
| Salgine Michael | $485,000 | -- | |
| Casimir John | $330,000 | -- |
Source: Public Records
Mortgage History
| Date | Status | Borrower | Loan Amount |
|---|---|---|---|
| Open | Schillero Joseph | $300,000 |
Source: Public Records
Tax History Compared to Growth
Tax History
| Year | Tax Paid | Tax Assessment Tax Assessment Total Assessment is a certain percentage of the fair market value that is determined by local assessors to be the total taxable value of land and additions on the property. | Land | Improvement |
|---|---|---|---|---|
| 2025 | $13,761 | $473 | $181 | $292 |
| 2024 | $4,199 | $473 | $181 | $292 |
| 2023 | $12,877 | $473 | $181 | $292 |
| 2022 | $12,877 | $473 | $181 | $292 |
| 2021 | $12,564 | $457 | $175 | $282 |
| 2020 | $12,055 | $593 | $584 | $9 |
| 2019 | $3,292 | $593 | $548 | $45 |
| 2018 | $6,004 | $632 | $0 | $0 |
| 2017 | $6,004 | $672 | $552 | $120 |
| 2016 | $9,371 | $711 | $524 | $187 |
| 2015 | $3,375 | $751 | $465 | $286 |
| 2014 | $3,375 | $751 | $465 | $286 |
| 2013 | $3,250 | $792 | $490 | $302 |
Source: Public Records
Map
Nearby Homes