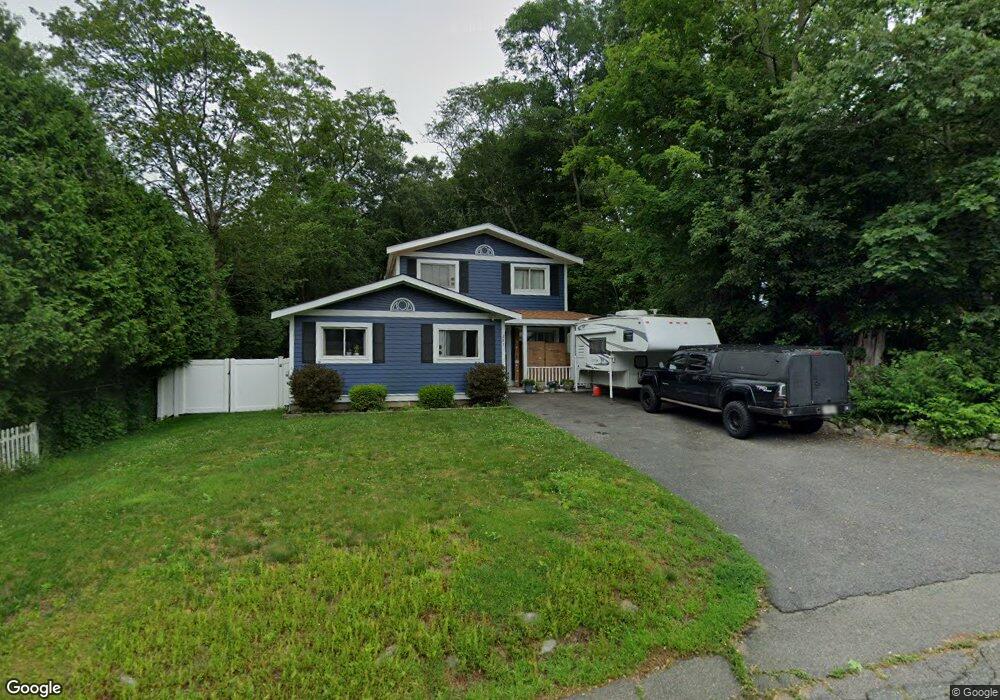
287 Pine St Unit none Whitman, MA 02382
Estimated Value: $523,314 - $573,000
4
Beds
2
Baths
1,419
Sq Ft
$379/Sq Ft
Est. Value
About This Home
This home is located at 287 Pine St Unit none, Whitman, MA 02382 and is currently estimated at $537,329, approximately $378 per square foot. 287 Pine St Unit none is a home located in Plymouth County with nearby schools including St Bridget School and Cardinal Spellman High School.
Ownership History
Date
Name
Owned For
Owner Type
Purchase Details
Closed on
Aug 6, 2013
Sold by
Oconnell Brianna J
Bought by
Oconnell Brianna J and Oconnell Robert T
Current Estimated Value
Home Financials for this Owner
Home Financials are based on the most recent Mortgage that was taken out on this home.
Original Mortgage
$216,000
Outstanding Balance
$157,769
Interest Rate
3.95%
Mortgage Type
New Conventional
Estimated Equity
$379,560
Purchase Details
Closed on
Nov 26, 2008
Sold by
Miller John D
Bought by
Matney Brianna J
Home Financials for this Owner
Home Financials are based on the most recent Mortgage that was taken out on this home.
Original Mortgage
$200,000
Interest Rate
6.47%
Mortgage Type
Purchase Money Mortgage
Purchase Details
Closed on
Jul 7, 1997
Sold by
Miller Susan
Bought by
Miller John D
Purchase Details
Closed on
Apr 6, 1995
Sold by
Department Of Housing & Urban Dev
Bought by
Mille Susan
Purchase Details
Closed on
May 3, 1994
Sold by
Oleary Kenneth M and Oleary Martha I
Bought by
Fleet Mtg Corp
Create a Home Valuation Report for This Property
The Home Valuation Report is an in-depth analysis detailing your home's value as well as a comparison with similar homes in the area
Home Values in the Area
Average Home Value in this Area
Purchase History
| Date | Buyer | Sale Price | Title Company |
|---|---|---|---|
| Oconnell Brianna J | -- | -- | |
| Matney Brianna J | $250,000 | -- | |
| Miller John D | $95,000 | -- | |
| Mille Susan | $64,900 | -- | |
| Fleet Mtg Corp | $114,983 | -- |
Source: Public Records
Mortgage History
| Date | Status | Borrower | Loan Amount |
|---|---|---|---|
| Open | Oconnell Brianna J | $216,000 | |
| Previous Owner | Fleet Mtg Corp | $225,000 | |
| Previous Owner | Fleet Mtg Corp | $200,000 |
Source: Public Records
Tax History
| Year | Tax Paid | Tax Assessment Tax Assessment Total Assessment is a certain percentage of the fair market value that is determined by local assessors to be the total taxable value of land and additions on the property. | Land | Improvement |
|---|---|---|---|---|
| 2025 | $5,976 | $455,500 | $231,300 | $224,200 |
| 2024 | $5,639 | $442,600 | $226,900 | $215,700 |
| 2023 | $5,231 | $385,500 | $196,700 | $188,800 |
| 2022 | $5,160 | $354,400 | $178,800 | $175,600 |
| 2021 | $4,985 | $321,600 | $164,300 | $157,300 |
| 2020 | $4,890 | $308,500 | $156,500 | $152,000 |
| 2019 | $4,705 | $305,900 | $156,500 | $149,400 |
| 2018 | $4,438 | $277,200 | $147,500 | $129,700 |
| 2017 | $4,180 | $277,200 | $147,500 | $129,700 |
| 2016 | $3,664 | $235,000 | $139,700 | $95,300 |
| 2015 | $3,289 | $210,700 | $122,900 | $87,800 |
Source: Public Records
Map
Nearby Homes
- 287 Pine St
- 291 Pine St
- 5 Hutchinson Terrace
- 293 Pine St
- 250 Pine St
- 13 Hutchinson Terrace
- 182 High St
- 16 Hutchinson Terrace
- 21 Hutchinson Terrace
- 200 High St
- 172 High St
- 22 Hutchinson Terrace
- 164 High St
- 164 High St
- 164 High St Unit 164
- 0 Mayflower Cir
- 27 Hutchinson Terrace
- 220 High St
- 242 High St
- 26 Hutchinson Terrace
Your Personal Tour Guide
Ask me questions while you tour the home.