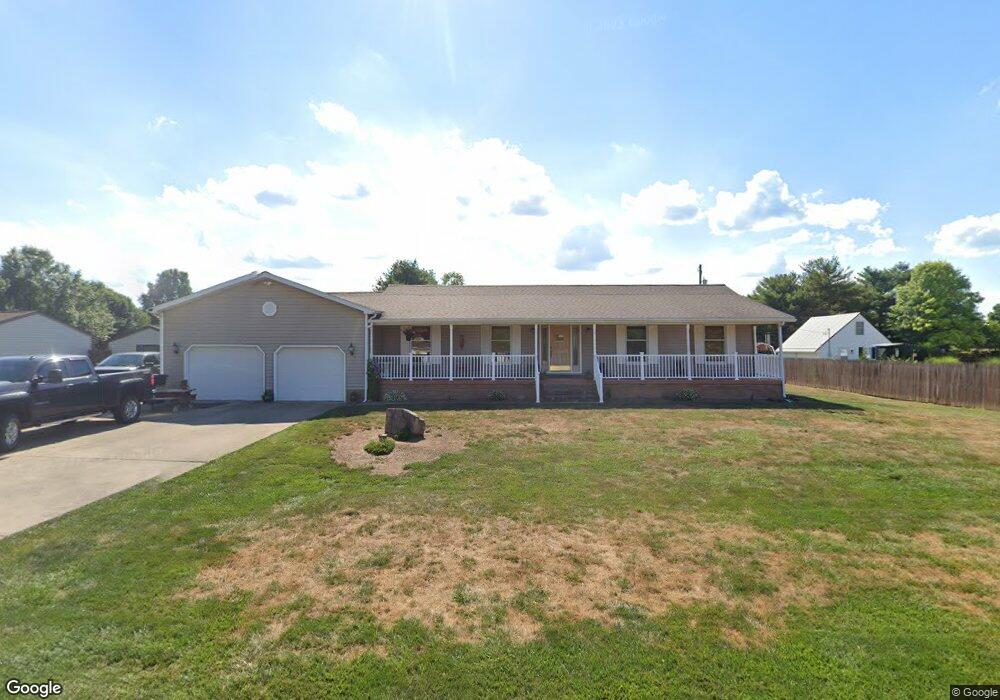
287 Queen Dr Chillicothe, OH 45601
Estimated Value: $269,000 - $383,000
3
Beds
2
Baths
1,547
Sq Ft
$205/Sq Ft
Est. Value
About This Home
This home is located at 287 Queen Dr, Chillicothe, OH 45601 and is currently estimated at $317,298, approximately $205 per square foot. 287 Queen Dr is a home located in Ross County with nearby schools including Paint Valley Elementary School, Paint Valley Middle School, and Paint Valley High School.
Ownership History
Date
Name
Owned For
Owner Type
Purchase Details
Closed on
Aug 11, 2017
Sold by
Davis Davain F
Bought by
Thornberry Penny J
Current Estimated Value
Home Financials for this Owner
Home Financials are based on the most recent Mortgage that was taken out on this home.
Original Mortgage
$118,750
Outstanding Balance
$63,663
Interest Rate
4.03%
Mortgage Type
New Conventional
Estimated Equity
$253,635
Purchase Details
Closed on
Dec 15, 2006
Sold by
Buskirk Mark A and Buskirk Crystal Robin
Bought by
Davis Dwain F
Home Financials for this Owner
Home Financials are based on the most recent Mortgage that was taken out on this home.
Original Mortgage
$150,000
Interest Rate
6.33%
Mortgage Type
Purchase Money Mortgage
Purchase Details
Closed on
Aug 26, 2005
Sold by
Wells Kenneth G
Bought by
Buskirk Mark A
Home Financials for this Owner
Home Financials are based on the most recent Mortgage that was taken out on this home.
Original Mortgage
$160,000
Interest Rate
7.75%
Mortgage Type
Future Advance Clause Open End Mortgage
Create a Home Valuation Report for This Property
The Home Valuation Report is an in-depth analysis detailing your home's value as well as a comparison with similar homes in the area
Home Values in the Area
Average Home Value in this Area
Purchase History
| Date | Buyer | Sale Price | Title Company |
|---|---|---|---|
| Thornberry Penny J | $125,000 | Chicago Title Of Ross Co | |
| Davis Dwain F | $188,000 | Title First | |
| Buskirk Mark A | -- | None Available |
Source: Public Records
Mortgage History
| Date | Status | Borrower | Loan Amount |
|---|---|---|---|
| Open | Thornberry Penny J | $118,750 | |
| Previous Owner | Davis Dwain F | $150,000 | |
| Previous Owner | Buskirk Mark A | $160,000 |
Source: Public Records
Tax History
| Year | Tax Paid | Tax Assessment Tax Assessment Total Assessment is a certain percentage of the fair market value that is determined by local assessors to be the total taxable value of land and additions on the property. | Land | Improvement |
|---|---|---|---|---|
| 2024 | $2,513 | $71,520 | $7,680 | $63,840 |
| 2023 | $2,513 | $71,520 | $7,680 | $63,840 |
| 2022 | $2,460 | $71,520 | $7,680 | $63,840 |
| 2021 | $2,319 | $63,040 | $6,980 | $56,060 |
| 2020 | $2,316 | $63,040 | $6,980 | $56,060 |
| 2019 | $2,361 | $63,040 | $6,980 | $56,060 |
| 2018 | $2,164 | $56,220 | $6,620 | $49,600 |
| 2017 | $2,218 | $68,000 | $6,620 | $61,380 |
| 2016 | $2,616 | $68,000 | $6,620 | $61,380 |
| 2015 | $2,079 | $53,980 | $6,620 | $47,360 |
| 2014 | $2,031 | $53,980 | $6,620 | $47,360 |
| 2013 | $2,065 | $53,980 | $6,620 | $47,360 |
Source: Public Records
Map
Nearby Homes
- 182 Eastlook Dr
- 161 Lana Ln
- 16673 State Route 28 Unit 9
- 41 Bow Cir
- 313 Goodale Dr
- 18818 U S 50
- 559 Golfview Dr
- 70 Willow Creek Rd
- 10217 County Road 550
- 637 Vernon Dr
- 320 Summerhill Dr
- 106 Stoneridge Ct Unit 106
- 190 Zickafoose Ln
- 232 Rolling Meadows Dr
- 0 Larrick Ln
- 13266 State Route 28
- 18 Ridge Dr
- 88 Fruit Hill Dr
- 239 Almahurst Dr
- 4 Ridge Dr
- 333 Queen Dr
- 280 Queen Dr
- 245 Queen Dr
- 377 Queen Dr
- 1574 Maple Grove Rd
- 1594 Maple Grove Rd
- 227 Queen Dr
- 296 Queen Dr
- 1534 Maple Grove Rd
- 1610 Maple Grove Rd
- 350 Queen Dr
- 320 Queen Dr
- 230 Queen Dr
- 230 Queen Dr
- 425 Queen Dr
- 199 Queen Dr
- 390 Queen Dr
- 1611 Maple Grove Rd
- 205 Meadow Dr
- 1512 Maple Grove Rd
Your Personal Tour Guide
Ask me questions while you tour the home.