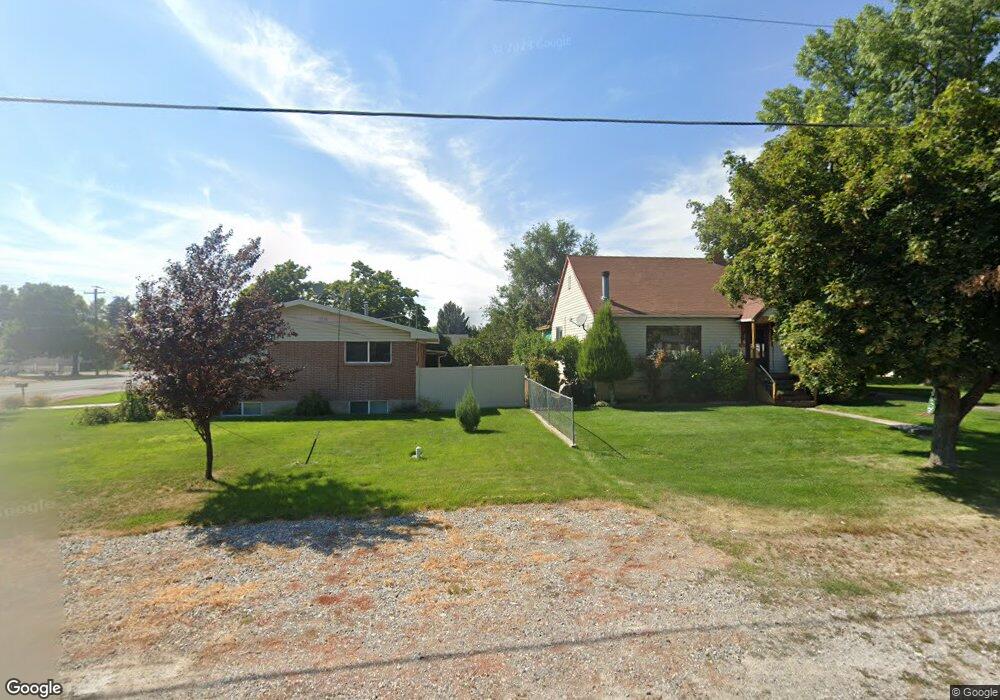
287 S 200 E Smithfield, UT 84335
Estimated Value: $503,000 - $622,000
4
Beds
1
Bath
1,299
Sq Ft
$437/Sq Ft
Est. Value
About This Home
This home is located at 287 S 200 E, Smithfield, UT 84335 and is currently estimated at $567,097, approximately $436 per square foot. 287 S 200 E is a home located in Cache County with nearby schools including Lewiston School, White Pine Middle School, and North Cache Middle School.
Ownership History
Date
Name
Owned For
Owner Type
Purchase Details
Closed on
Jun 16, 2015
Sold by
Thayne Jared H and Thayne Raeanne R
Bought by
Jared & Raeanne Thayne Living Trust and Thayne Raeanne R
Current Estimated Value
Purchase Details
Closed on
Dec 4, 2012
Sold by
Thayne Jared H
Bought by
Thayne Jared H and Thayne Raeanne R
Home Financials for this Owner
Home Financials are based on the most recent Mortgage that was taken out on this home.
Original Mortgage
$117,000
Outstanding Balance
$19,975
Interest Rate
3.36%
Mortgage Type
New Conventional
Estimated Equity
$547,122
Purchase Details
Closed on
Feb 23, 2005
Sold by
Lillywhite David R
Bought by
Thayne Jared H
Home Financials for this Owner
Home Financials are based on the most recent Mortgage that was taken out on this home.
Original Mortgage
$124,160
Interest Rate
5.73%
Mortgage Type
New Conventional
Create a Home Valuation Report for This Property
The Home Valuation Report is an in-depth analysis detailing your home's value as well as a comparison with similar homes in the area
Purchase History
| Date | Buyer | Sale Price | Title Company |
|---|---|---|---|
| Jared & Raeanne Thayne Living Trust | -- | None Available | |
| Thayne Jared H | -- | Northern Title Company | |
| Thayne Jared H | -- | Cache Title Company |
Source: Public Records
Mortgage History
| Date | Status | Borrower | Loan Amount |
|---|---|---|---|
| Open | Thayne Jared H | $117,000 | |
| Closed | Thayne Jared H | $124,160 |
Source: Public Records
Tax History
| Year | Tax Paid | Tax Assessment Tax Assessment Total Assessment is a certain percentage of the fair market value that is determined by local assessors to be the total taxable value of land and additions on the property. | Land | Improvement |
|---|---|---|---|---|
| 2025 | $2,415 | $323,310 | $0 | $0 |
| 2024 | $225 | $282,255 | $0 | $0 |
| 2023 | $2,371 | $281,540 | $0 | $0 |
| 2022 | $2,191 | $256,000 | $0 | $0 |
| 2021 | $2,164 | $386,365 | $70,000 | $316,365 |
| 2020 | $1,934 | $322,114 | $70,000 | $252,114 |
| 2019 | $1,872 | $297,114 | $45,000 | $252,114 |
| 2018 | $1,721 | $264,230 | $45,000 | $219,230 |
| 2017 | $1,602 | $134,365 | $0 | $0 |
| 2016 | $1,630 | $111,330 | $0 | $0 |
| 2015 | $1,356 | $111,330 | $0 | $0 |
| 2014 | $1,330 | $111,330 | $0 | $0 |
| 2013 | -- | $111,330 | $0 | $0 |
Source: Public Records
Map
Nearby Homes
- 312 W 200 N Unit 10
- 222 W 200 N Unit 18
- 165 W 200 N
- 136 W 200 N Unit 21
- 244 W 200 N Unit 17
- 260 W 200 N Unit 16
- 158 W 200 N Unit 20
- 116 W 200 N Unit 22
- 362 W 200 N Unit 8
- 340 W 200 N Unit 9
- 115 N 100 W Unit 23
- 180 N 300 W
- 144 N 300 W Unit 13
- 141 N 300 W Unit 12
- 165 N 300 W Unit 11
- 172 N 300 W Unit 14
- 15 S 400 W
- 6953 W 6600 N Unit 3
- 7900 N 5600 W
- 9000 N 6400 W
Your Personal Tour Guide
Ask me questions while you tour the home.