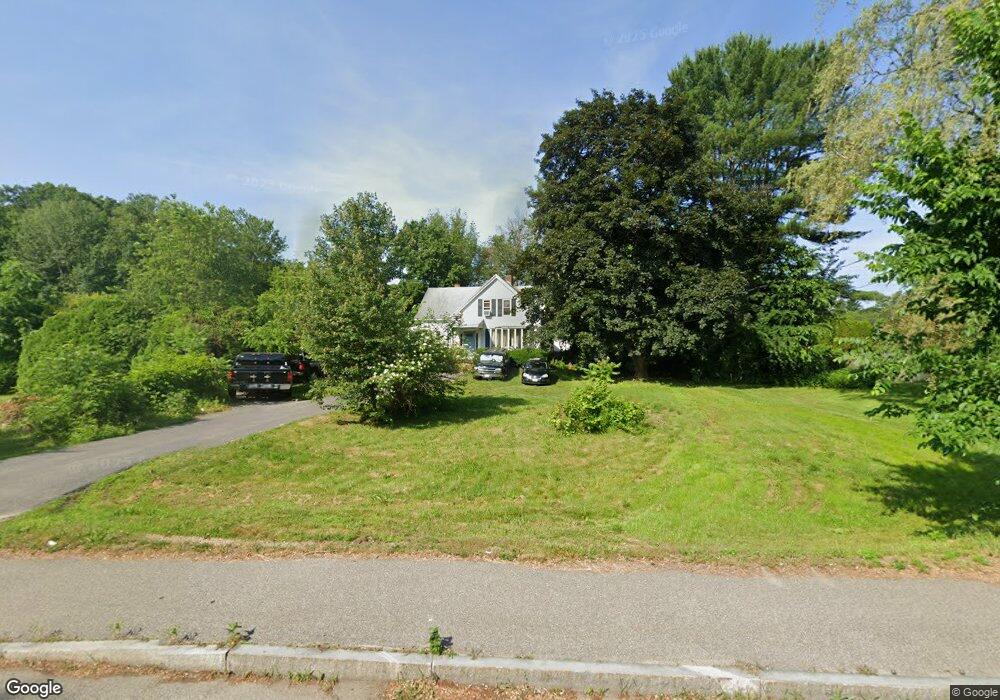
287 S Main St Unit 1 West Bridgewater, MA 02379
Estimated Value: $612,000 - $618,000
4
Beds
2
Baths
1,871
Sq Ft
$329/Sq Ft
Est. Value
About This Home
This home is located at 287 S Main St Unit 1, West Bridgewater, MA 02379 and is currently estimated at $614,932, approximately $328 per square foot. 287 S Main St Unit 1 is a home located in Plymouth County with nearby schools including Spring Street Elementary School, Howard Elementary School, and Rose L. MacDonald Elementary School.
Ownership History
Date
Name
Owned For
Owner Type
Purchase Details
Closed on
Jul 15, 2016
Sold by
Cherry Mark B
Bought by
Gorman Melissa A and Nee Shaen M
Current Estimated Value
Home Financials for this Owner
Home Financials are based on the most recent Mortgage that was taken out on this home.
Original Mortgage
$316,665
Outstanding Balance
$252,767
Interest Rate
3.66%
Mortgage Type
VA
Estimated Equity
$362,165
Purchase Details
Closed on
Nov 16, 2012
Sold by
Craig Linda I and Craig Taylor J
Bought by
Cherry Mark B
Home Financials for this Owner
Home Financials are based on the most recent Mortgage that was taken out on this home.
Original Mortgage
$268,055
Interest Rate
3.25%
Mortgage Type
FHA
Purchase Details
Closed on
Sep 13, 2001
Sold by
Corcoran Joyce J and Corcoran Calvin J
Bought by
Craig Joseph M and Craig Linda L
Create a Home Valuation Report for This Property
The Home Valuation Report is an in-depth analysis detailing your home's value as well as a comparison with similar homes in the area
Home Values in the Area
Average Home Value in this Area
Purchase History
| Date | Buyer | Sale Price | Title Company |
|---|---|---|---|
| Gorman Melissa A | $310,000 | -- | |
| Cherry Mark B | $273,000 | -- | |
| Craig Joseph M | $4,000 | -- |
Source: Public Records
Mortgage History
| Date | Status | Borrower | Loan Amount |
|---|---|---|---|
| Open | Gorman Melissa A | $316,665 | |
| Previous Owner | Cherry Mark B | $268,055 | |
| Previous Owner | Craig Joseph M | $213,750 | |
| Previous Owner | Craig Joseph M | $95,000 |
Source: Public Records
Tax History Compared to Growth
Tax History
| Year | Tax Paid | Tax Assessment Tax Assessment Total Assessment is a certain percentage of the fair market value that is determined by local assessors to be the total taxable value of land and additions on the property. | Land | Improvement |
|---|---|---|---|---|
| 2025 | $6,462 | $472,700 | $218,200 | $254,500 |
| 2024 | $6,216 | $438,700 | $197,800 | $240,900 |
| 2023 | $5,821 | $378,700 | $171,300 | $207,400 |
| 2022 | $5,538 | $341,400 | $161,100 | $180,300 |
| 2021 | $5,418 | $341,400 | $161,100 | $180,300 |
| 2020 | $5,589 | $341,400 | $161,100 | $180,300 |
| 2019 | $4,958 | $330,700 | $161,100 | $169,600 |
| 2018 | $5,188 | $311,000 | $152,900 | $158,100 |
| 2017 | $5,757 | $289,300 | $138,700 | $150,600 |
| 2016 | $5,031 | $279,500 | $128,900 | $150,600 |
| 2015 | $5,038 | $282,900 | $128,900 | $154,000 |
| 2014 | $4,675 | $283,500 | $128,900 | $154,600 |
Source: Public Records
Map
Nearby Homes
- 30 Keenan St
- 192 S Main St
- 92 Bryant St
- 603 East St
- 34 Captain Carlson Way
- 86 Wall St
- 6 Andrea Way
- 18 Aldrich Rd
- 116 Center St
- 4 Mullen Way
- 10 Duck Farm Ln
- 60 Miranda Way
- 248 Center St Unit 7
- 29 Ellis Ave
- 245-r Laurel St
- 10 Charles St
- 10 College Rd
- 180 Main St Unit A15
- 180 Main St Unit A5
- Lot 2 Fontana Way