Estimated Value: $159,000 - $203,000
2
Beds
3
Baths
2,320
Sq Ft
$78/Sq Ft
Est. Value
About This Home
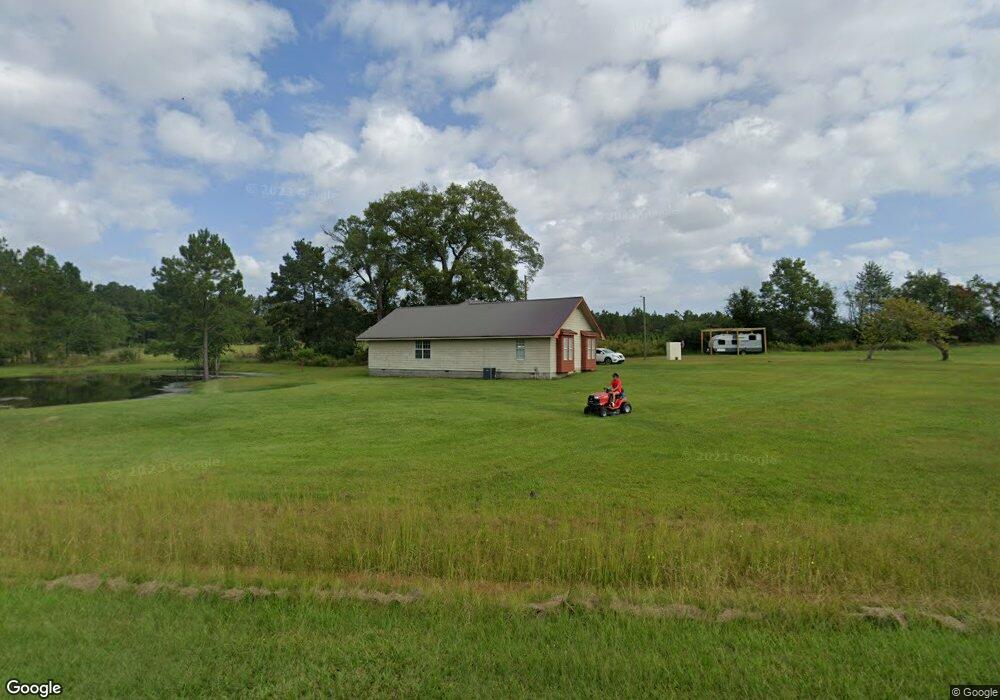
This home is located at 287 Shenandoah Rd, Alma, GA 31510 and is currently estimated at $181,821, approximately $78 per square foot. 287 Shenandoah Rd is a home located in Bacon County with nearby schools including Bacon County Primary School, Bacon County Elementary School, and Bacon County Middle School.
Ownership History
Date
Name
Owned For
Owner Type
Purchase Details
Closed on
Aug 6, 2021
Sold by
Hendrickson Sandra T
Bought by
Anderson David S
Current Estimated Value
Home Financials for this Owner
Home Financials are based on the most recent Mortgage that was taken out on this home.
Original Mortgage
$140,500
Outstanding Balance
$127,758
Interest Rate
2.9%
Mortgage Type
VA
Estimated Equity
$54,063
Purchase Details
Closed on
Sep 4, 2020
Sold by
Lane Minnie
Bought by
Hendrickson Sandra T and Hendrickson Gary Lester
Home Financials for this Owner
Home Financials are based on the most recent Mortgage that was taken out on this home.
Original Mortgage
$67,299
Interest Rate
2.8%
Mortgage Type
New Conventional
Purchase Details
Closed on
Aug 5, 2014
Sold by
Tanner Louise
Bought by
Lane Minnie
Purchase Details
Closed on
May 27, 2010
Sold by
Lane Minnie
Bought by
Tanner Russell
Create a Home Valuation Report for This Property
The Home Valuation Report is an in-depth analysis detailing your home's value as well as a comparison with similar homes in the area
Home Values in the Area
Average Home Value in this Area
Purchase History
| Date | Buyer | Sale Price | Title Company |
|---|---|---|---|
| Anderson David S | $140,500 | -- | |
| Hendrickson Sandra T | $77,500 | -- | |
| Lane Minnie | $20,000 | -- | |
| Tanner Russell | $10,000 | -- |
Source: Public Records
Mortgage History
| Date | Status | Borrower | Loan Amount |
|---|---|---|---|
| Open | Anderson David S | $140,500 | |
| Previous Owner | Hendrickson Sandra T | $67,299 |
Source: Public Records
Tax History Compared to Growth
Tax History
| Year | Tax Paid | Tax Assessment Tax Assessment Total Assessment is a certain percentage of the fair market value that is determined by local assessors to be the total taxable value of land and additions on the property. | Land | Improvement |
|---|---|---|---|---|
| 2024 | $1,571 | $60,200 | $4,320 | $55,880 |
| 2023 | $2,301 | $84,440 | $4,080 | $80,360 |
| 2022 | $1,531 | $61,320 | $4,080 | $57,240 |
| 2021 | $845 | $57,560 | $4,080 | $53,480 |
| 2020 | $1,474 | $51,860 | $3,410 | $48,450 |
| 2019 | $1,476 | $51,860 | $3,410 | $48,450 |
| 2018 | $1,412 | $49,980 | $3,410 | $46,570 |
| 2017 | $1,436 | $49,980 | $3,410 | $46,570 |
| 2016 | $1,398 | $49,980 | $3,410 | $46,570 |
| 2015 | $1,197 | $48,942 | $3,410 | $45,533 |
| 2014 | $963 | $48,942 | $3,410 | $45,533 |
| 2013 | $963 | $36,569 | $3,710 | $32,858 |
Source: Public Records
Map
Nearby Homes
- 261 Colorado Rd
- W 4th St
- 4th Street
- Stewart Cemetery Rd
- 174 Perch Rd
- 0 Stewart Cemetery Rd
- 0 Lake Lure Dr
- 151 Lake Gloria Ln
- 220 Lake Shore Dr
- 220 Lakeshore Dr
- 1608 W 4th St
- 1505 W 4th Street Extension
- 0 W 4th Street Extension Unit 10650393
- 0 Oriole Rd Unit 1654653
- 0 Oriole Rd Unit 10543585
- 0 Oriole Rd Unit 23852171
- 0 Oriole Rd Unit 160930
- 1109 W 4th Street Extension
- 401 Lee St
- 907 N Pierce St
- 277 Shenandoah Rd
- 117 Leasure Ln
- 255 Shenandoah Rd
- 131 Morgan Trail
- 342 Shenandoah Rd
- 229 Shenandoah Rd
- 104 Cowboy Ln
- 145 Tanner Rd
- 210 Shenandoah Rd
- 110 Cowboy Ln
- 190 Shenandoah Rd
- 120 Cowboy Ln
- 191 Shenandoah Rd
- 116 Inlet Way
- 386 Shenandoah Rd
- 171 Shenandoah Rd
- 106 Inlet Way
- 101 Redhorse Ln
- 000 Shenandoah Rd Unit n/a
- 122 Oyster Shell Rd