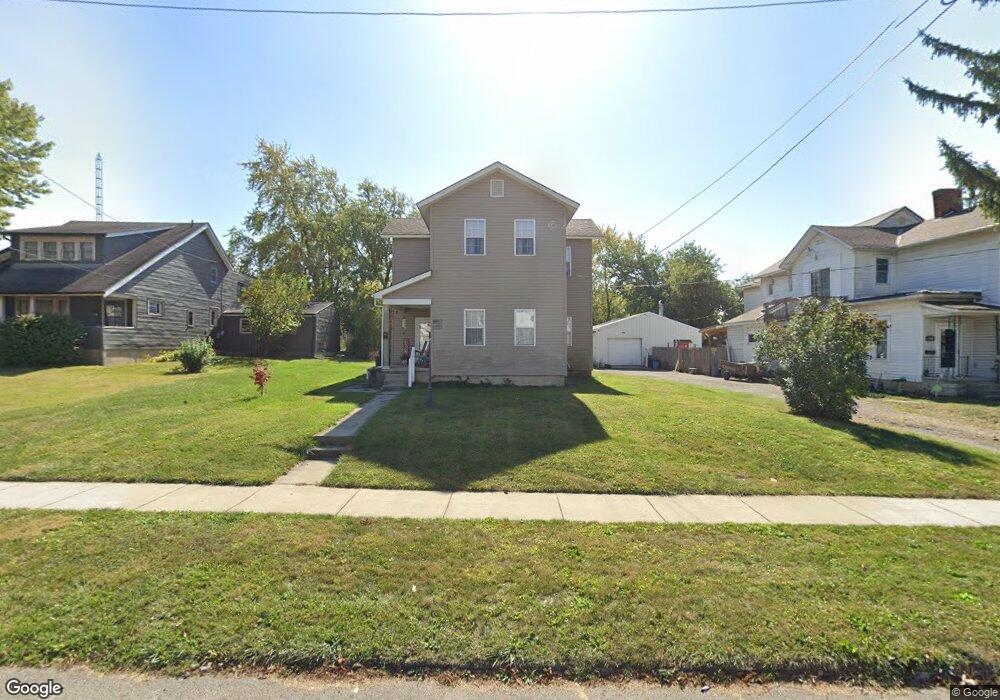
287 Silver St Marion, OH 43302
Estimated Value: $85,000 - $100,000
4
Beds
2
Baths
2,130
Sq Ft
$43/Sq Ft
Est. Value
About This Home
This home is located at 287 Silver St, Marion, OH 43302 and is currently estimated at $90,796, approximately $42 per square foot. 287 Silver St is a home located in Marion County with nearby schools including Rutherford B. Hayes Elementary School, Ulysses S. Grant Middle School, and Harding High School.
Ownership History
Date
Name
Owned For
Owner Type
Purchase Details
Closed on
Dec 26, 2024
Sold by
Blevins Nanette
Bought by
Maniaci Jacqueline
Current Estimated Value
Purchase Details
Closed on
Oct 12, 2016
Sold by
Blevins Robert Lee and Blevins Nanette
Bought by
Blevins Nanette
Purchase Details
Closed on
Oct 27, 2010
Sold by
The Fahey Banking Co
Bought by
Blevins Robert L and Blevins Nanette
Purchase Details
Closed on
Mar 29, 2010
Sold by
Blair Brian L
Bought by
The Fahey Banking Co
Purchase Details
Closed on
Jan 27, 2003
Bought by
Blevins Robert L and Nanette Surv
Purchase Details
Closed on
Aug 2, 2002
Bought by
Blevins Robert L and Nanette Surv
Purchase Details
Closed on
Sep 10, 2001
Bought by
Blevins Robert L and Nanette Surv
Create a Home Valuation Report for This Property
The Home Valuation Report is an in-depth analysis detailing your home's value as well as a comparison with similar homes in the area
Home Values in the Area
Average Home Value in this Area
Purchase History
| Date | Buyer | Sale Price | Title Company |
|---|---|---|---|
| Maniaci Jacqueline | -- | None Listed On Document | |
| Maniaci Jacqueline | -- | None Listed On Document | |
| Blevins Nanette | -- | None Available | |
| Blevins Robert L | $13,000 | None Available | |
| The Fahey Banking Co | $13,334 | None Available | |
| Blevins Robert L | $5,000 | -- | |
| Blevins Robert L | $5,000 | -- | |
| Blevins Robert L | $24,000 | -- |
Source: Public Records
Tax History Compared to Growth
Tax History
| Year | Tax Paid | Tax Assessment Tax Assessment Total Assessment is a certain percentage of the fair market value that is determined by local assessors to be the total taxable value of land and additions on the property. | Land | Improvement |
|---|---|---|---|---|
| 2024 | $967 | $25,200 | $1,940 | $23,260 |
| 2023 | $967 | $25,200 | $1,940 | $23,260 |
| 2022 | $898 | $25,200 | $1,940 | $23,260 |
| 2021 | $775 | $19,580 | $1,690 | $17,890 |
| 2020 | $777 | $19,580 | $1,690 | $17,890 |
| 2019 | $756 | $19,580 | $1,690 | $17,890 |
| 2018 | $756 | $19,330 | $1,660 | $17,670 |
| 2017 | $766 | $19,330 | $1,660 | $17,670 |
| 2016 | $772 | $19,330 | $1,660 | $17,670 |
| 2015 | $773 | $18,940 | $1,580 | $17,360 |
| 2014 | $669 | $16,340 | $1,580 | $14,760 |
| 2012 | $437 | $10,630 | $1,730 | $8,900 |
Source: Public Records
Map
Nearby Homes
- 347 Mary St
- 343 Commercial St
- 233 Tully St
- 395 N Main St
- 178 Leader St
- 551 Universal Ave Unit 555
- 552 N Prospect St
- 434 N State St
- 325 Holmes Place
- 636 Mary St
- 455 Park St
- 593 N State St
- 468 Avondale Ave
- 485 Avondale Ave
- 374 Nunin Ct
- 458 Ballentine Ave
- 520 Toledo Ave
- 291 Patten St
- 229 W Columbia St
- 286 Patterson St