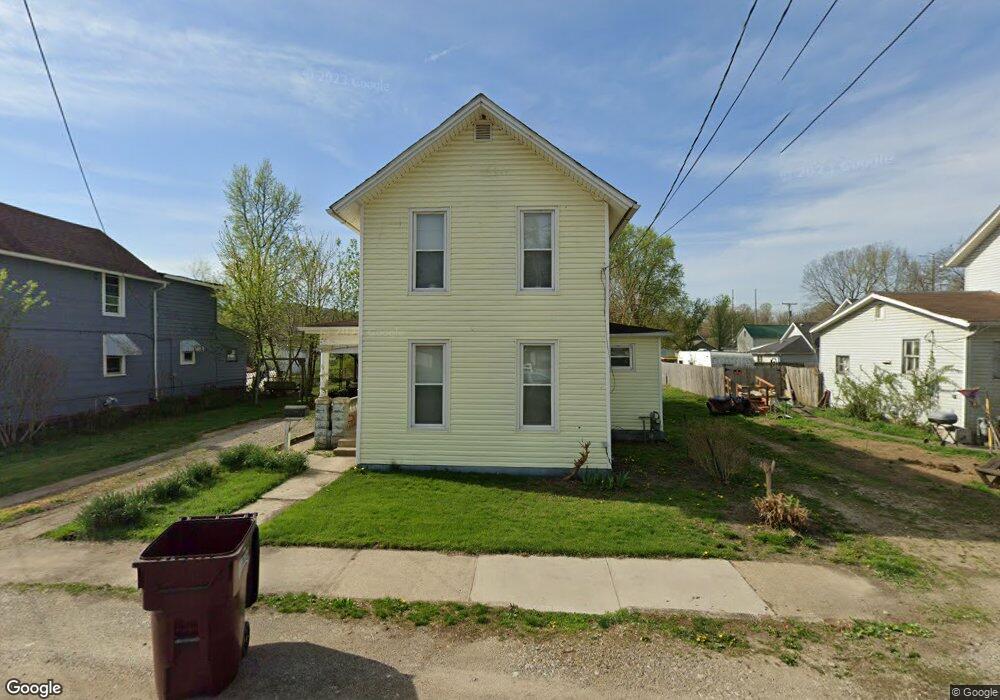
287 Summer St Newark, OH 43055
Estimated Value: $126,296 - $148,000
3
Beds
1
Bath
1,632
Sq Ft
$85/Sq Ft
Est. Value
About This Home
This home is located at 287 Summer St, Newark, OH 43055 and is currently estimated at $138,574, approximately $84 per square foot. 287 Summer St is a home located in Licking County with nearby schools including Ben Franklin Elementary School, Heritage Middle School, and Newark High School.
Ownership History
Date
Name
Owned For
Owner Type
Purchase Details
Closed on
Aug 5, 1999
Sold by
Whitaker James H
Bought by
Swango Sara M
Current Estimated Value
Home Financials for this Owner
Home Financials are based on the most recent Mortgage that was taken out on this home.
Original Mortgage
$57,150
Outstanding Balance
$16,461
Interest Rate
7.68%
Mortgage Type
New Conventional
Estimated Equity
$122,113
Purchase Details
Closed on
Jun 21, 1996
Sold by
Jones Anna M
Bought by
Whitaker James H and Whitaker Kristina L
Home Financials for this Owner
Home Financials are based on the most recent Mortgage that was taken out on this home.
Original Mortgage
$20,700
Interest Rate
8.29%
Mortgage Type
New Conventional
Create a Home Valuation Report for This Property
The Home Valuation Report is an in-depth analysis detailing your home's value as well as a comparison with similar homes in the area
Home Values in the Area
Average Home Value in this Area
Purchase History
| Date | Buyer | Sale Price | Title Company |
|---|---|---|---|
| Swango Sara M | $55,900 | -- | |
| Whitaker James H | $25,000 | -- |
Source: Public Records
Mortgage History
| Date | Status | Borrower | Loan Amount |
|---|---|---|---|
| Open | Swango Sara M | $57,150 | |
| Previous Owner | Whitaker James H | $20,700 |
Source: Public Records
Tax History Compared to Growth
Tax History
| Year | Tax Paid | Tax Assessment Tax Assessment Total Assessment is a certain percentage of the fair market value that is determined by local assessors to be the total taxable value of land and additions on the property. | Land | Improvement |
|---|---|---|---|---|
| 2024 | $1,053 | $29,410 | $5,080 | $24,330 |
| 2023 | $1,051 | $29,410 | $5,080 | $24,330 |
| 2022 | $930 | $23,110 | $2,980 | $20,130 |
| 2021 | $975 | $23,110 | $2,980 | $20,130 |
| 2020 | $997 | $23,110 | $2,980 | $20,130 |
| 2019 | $848 | $18,910 | $2,140 | $16,770 |
| 2018 | $849 | $0 | $0 | $0 |
| 2017 | $798 | $0 | $0 | $0 |
| 2016 | $766 | $0 | $0 | $0 |
| 2015 | $782 | $0 | $0 | $0 |
| 2014 | $1,001 | $0 | $0 | $0 |
| 2013 | $744 | $0 | $0 | $0 |
Source: Public Records
Map
Nearby Homes