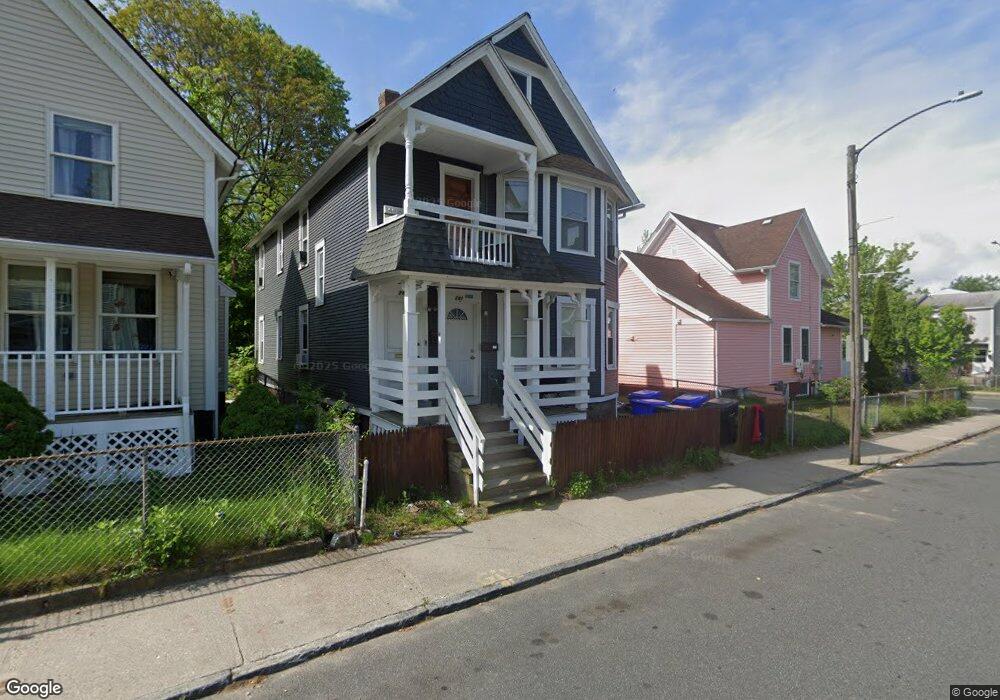
287 Tyler St Unit 289 Springfield, MA 01109
Old Hill NeighborhoodEstimated Value: $270,102 - $420,000
4
Beds
2
Baths
2,008
Sq Ft
$180/Sq Ft
Est. Value
About This Home
This home is located at 287 Tyler St Unit 289, Springfield, MA 01109 and is currently estimated at $361,276, approximately $179 per square foot. 287 Tyler St Unit 289 is a home located in Hampden County with nearby schools including William N. DeBerry Elementary School, M Marcus Kiley Middle, and High School Of Commerce.
Ownership History
Date
Name
Owned For
Owner Type
Purchase Details
Closed on
Jun 19, 2007
Sold by
Bernal Nery A
Bought by
Argueta German and Bernal Nery A
Current Estimated Value
Purchase Details
Closed on
Feb 26, 2003
Sold by
Difranco Mark C
Bought by
Difranco Mark C and N&W Associates Inc
Purchase Details
Closed on
Mar 27, 1992
Sold by
Stern Peter M and Lemonde Roger A
Bought by
287 Tyler St Rt
Home Financials for this Owner
Home Financials are based on the most recent Mortgage that was taken out on this home.
Original Mortgage
$35,000
Interest Rate
8.78%
Purchase Details
Closed on
Oct 3, 1989
Sold by
Lajzer Susan V
Bought by
Lemonde Roger
Home Financials for this Owner
Home Financials are based on the most recent Mortgage that was taken out on this home.
Original Mortgage
$104,000
Interest Rate
9.92%
Mortgage Type
Purchase Money Mortgage
Create a Home Valuation Report for This Property
The Home Valuation Report is an in-depth analysis detailing your home's value as well as a comparison with similar homes in the area
Home Values in the Area
Average Home Value in this Area
Purchase History
| Date | Buyer | Sale Price | Title Company |
|---|---|---|---|
| Argueta German | -- | -- | |
| Difranco Mark C | -- | -- | |
| 287 Tyler St Rt | $10,000 | -- | |
| Lemonde Roger | $130,000 | -- |
Source: Public Records
Mortgage History
| Date | Status | Borrower | Loan Amount |
|---|---|---|---|
| Previous Owner | Lemonde Roger | $53,000 | |
| Previous Owner | Lemonde Roger | $35,000 | |
| Previous Owner | Lemonde Roger | $104,000 |
Source: Public Records
Tax History
| Year | Tax Paid | Tax Assessment Tax Assessment Total Assessment is a certain percentage of the fair market value that is determined by local assessors to be the total taxable value of land and additions on the property. | Land | Improvement |
|---|---|---|---|---|
| 2025 | $2,758 | $175,900 | $22,100 | $153,800 |
| 2024 | $2,446 | $152,300 | $20,700 | $131,600 |
| 2023 | $2,611 | $131,600 | $19,700 | $111,900 |
| 2022 | $2,388 | $126,900 | $17,900 | $109,000 |
| 2021 | $2,306 | $122,000 | $16,300 | $105,700 |
| 2020 | $1,836 | $94,000 | $16,300 | $77,700 |
| 2019 | $1,692 | $86,000 | $16,300 | $69,700 |
| 2018 | $1,925 | $82,300 | $16,300 | $66,000 |
| 2017 | $1,577 | $80,200 | $13,100 | $67,100 |
| 2016 | $1,408 | $71,600 | $13,100 | $58,500 |
| 2015 | $1,220 | $62,000 | $13,100 | $48,900 |
Source: Public Records
Map
Nearby Homes
Your Personal Tour Guide
Ask me questions while you tour the home.