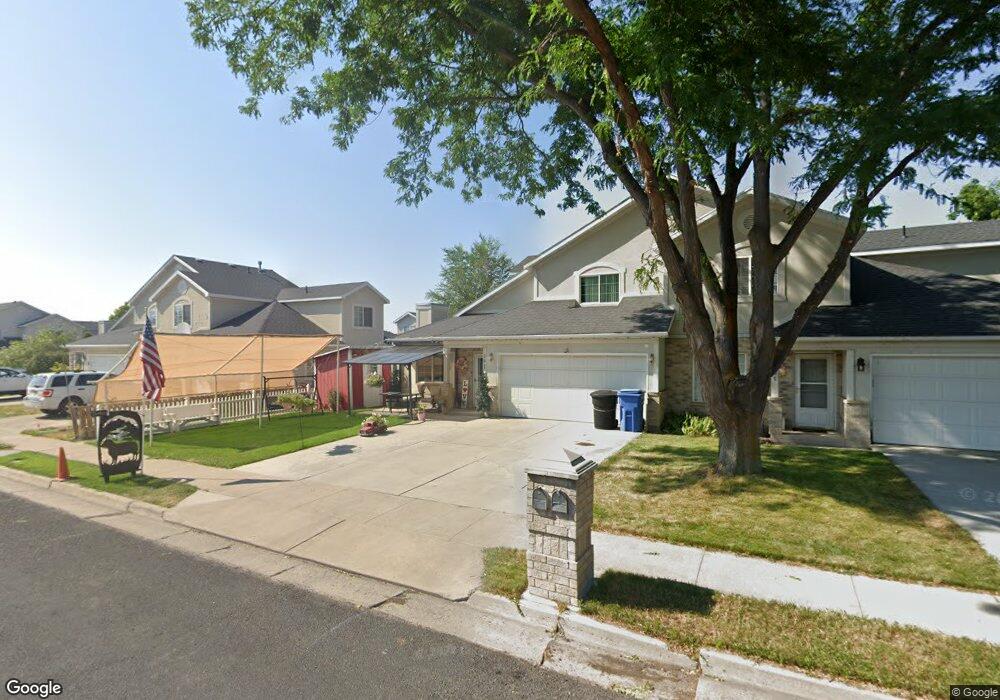
287 W 1140 N Logan, UT 84341
Bridger NeighborhoodEstimated Value: $336,000 - $389,163
3
Beds
3
Baths
1,616
Sq Ft
$220/Sq Ft
Est. Value
About This Home
This home is located at 287 W 1140 N, Logan, UT 84341 and is currently estimated at $355,291, approximately $219 per square foot. 287 W 1140 N is a home located in Cache County with nearby schools including Bridger School, Mount Logan Middle School, and Logan High School.
Ownership History
Date
Name
Owned For
Owner Type
Purchase Details
Closed on
Nov 6, 2017
Sold by
Turner Alan Jay and Turner Larue
Bought by
Larner Turner Alan and Larner Turner
Current Estimated Value
Home Financials for this Owner
Home Financials are based on the most recent Mortgage that was taken out on this home.
Original Mortgage
$132,225
Outstanding Balance
$110,269
Interest Rate
3.85%
Mortgage Type
New Conventional
Estimated Equity
$245,022
Purchase Details
Closed on
May 15, 2014
Sold by
Turner Kelly Jay
Bought by
Turner Alan Jay and Turner Larue
Purchase Details
Closed on
Jan 11, 2010
Sold by
Rushing John L
Bought by
Turner Kelly J
Home Financials for this Owner
Home Financials are based on the most recent Mortgage that was taken out on this home.
Original Mortgage
$143,355
Interest Rate
4.77%
Mortgage Type
FHA
Create a Home Valuation Report for This Property
The Home Valuation Report is an in-depth analysis detailing your home's value as well as a comparison with similar homes in the area
Home Values in the Area
Average Home Value in this Area
Purchase History
| Date | Buyer | Sale Price | Title Company |
|---|---|---|---|
| Larner Turner Alan | -- | -- | |
| Turner Alan Jay | -- | None Available | |
| Turner Kelly J | -- | Cache Title Company |
Source: Public Records
Mortgage History
| Date | Status | Borrower | Loan Amount |
|---|---|---|---|
| Open | Larner Turner Alan | $132,225 | |
| Closed | Turner Kelly J | $143,355 |
Source: Public Records
Tax History Compared to Growth
Tax History
| Year | Tax Paid | Tax Assessment Tax Assessment Total Assessment is a certain percentage of the fair market value that is determined by local assessors to be the total taxable value of land and additions on the property. | Land | Improvement |
|---|---|---|---|---|
| 2025 | $1,603 | $376,987 | $132,600 | $244,387 |
| 2024 | $1,655 | $376,987 | $132,600 | $244,387 |
| 2023 | $1,725 | $374,387 | $130,000 | $244,387 |
| 2022 | $1,590 | $322,387 | $78,000 | $244,387 |
| 2021 | $1,367 | $235,510 | $40,000 | $195,510 |
| 2020 | $1,324 | $205,209 | $40,000 | $165,209 |
| 2019 | $1,384 | $205,209 | $40,000 | $165,209 |
| 2018 | $1,356 | $183,660 | $40,000 | $143,660 |
| 2017 | $1,234 | $88,330 | $0 | $0 |
| 2016 | $1,279 | $81,235 | $0 | $0 |
| 2015 | $1,075 | $74,180 | $0 | $0 |
| 2014 | $972 | $74,180 | $0 | $0 |
| 2013 | -- | $74,180 | $0 | $0 |
Source: Public Records
Map
Nearby Homes
- 2200 N 220 W
- 1030 N 130 W Unit 100
- 897 N 250 W
- 894 N 400 W
- 873 N 480 W
- 559 W 1350 N Unit 41
- 430 W 810 N
- 420 W 750 N
- 1515 N 450 W Unit 103
- 514 W 1490 N Unit 102
- 539 W 1465 N Unit 17-102
- 20 Kings Ct
- 1492 N 565 W Unit 101
- 190 Kings Ct
- 345 W 690 N
- 365 W 690 N
- 223 W 730 N
- 243 W 730 N
- 190 W 700 N
- 227 W 690 N