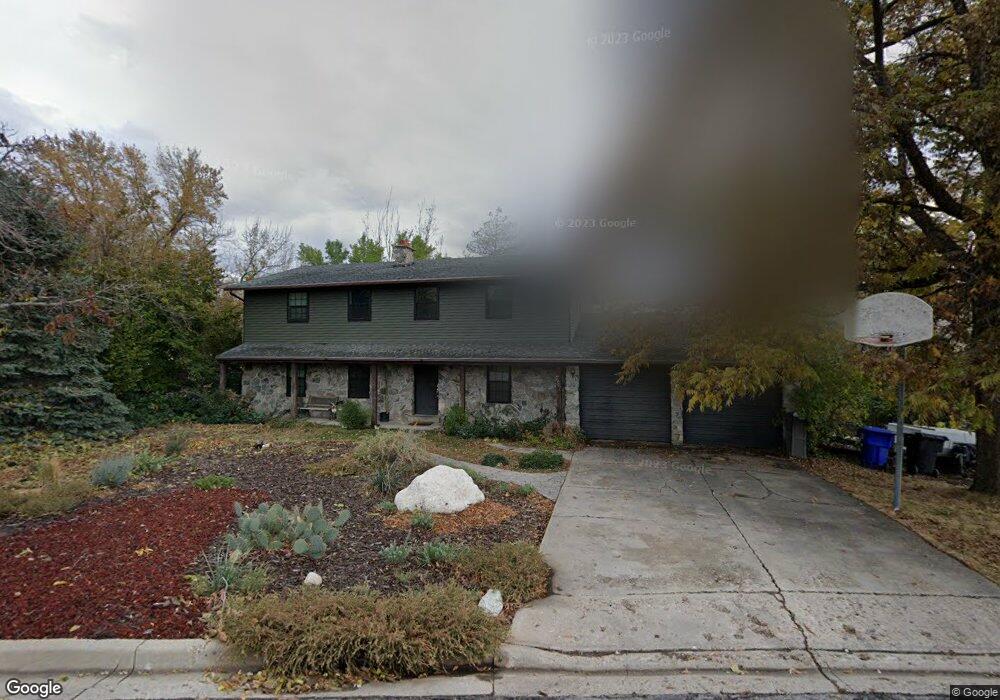
287 W 1950 N Centerville, UT 84014
Estimated Value: $599,000 - $1,023,000
4
Beds
2
Baths
2,449
Sq Ft
$292/Sq Ft
Est. Value
About This Home
This home is located at 287 W 1950 N, Centerville, UT 84014 and is currently estimated at $716,280, approximately $292 per square foot. 287 W 1950 N is a home located in Davis County with nearby schools including Reading School, Centerville Jr High, and Viewmont High School.
Ownership History
Date
Name
Owned For
Owner Type
Purchase Details
Closed on
Jun 6, 2023
Sold by
Allen David L
Bought by
David L Allen Investment Trust
Current Estimated Value
Purchase Details
Closed on
Oct 27, 2003
Sold by
Allen Kathy
Bought by
Allen David L
Home Financials for this Owner
Home Financials are based on the most recent Mortgage that was taken out on this home.
Original Mortgage
$94,000
Interest Rate
6.14%
Mortgage Type
Purchase Money Mortgage
Purchase Details
Closed on
Oct 20, 2003
Sold by
Allen David L
Bought by
Allen David L
Home Financials for this Owner
Home Financials are based on the most recent Mortgage that was taken out on this home.
Original Mortgage
$94,000
Interest Rate
6.14%
Mortgage Type
Purchase Money Mortgage
Purchase Details
Closed on
Jul 28, 2003
Sold by
Allen Kathleen
Bought by
Allen David L
Purchase Details
Closed on
Feb 24, 2000
Sold by
Allen David L and Allen Kathleen L
Bought by
Allen David L and Allen Kathleen
Create a Home Valuation Report for This Property
The Home Valuation Report is an in-depth analysis detailing your home's value as well as a comparison with similar homes in the area
Purchase History
| Date | Buyer | Sale Price | Title Company |
|---|---|---|---|
| David L Allen Investment Trust | -- | None Listed On Document | |
| David L Allen Investment Trust | -- | None Listed On Document | |
| Allen David L | -- | Township Title Ins Agency In | |
| Allen David L | -- | Township Title Ins Agency In | |
| Allen David L | $90,000 | -- | |
| Allen David L | -- | -- |
Source: Public Records
Mortgage History
| Date | Status | Borrower | Loan Amount |
|---|---|---|---|
| Previous Owner | Allen David L | $94,000 |
Source: Public Records
Tax History
| Year | Tax Paid | Tax Assessment Tax Assessment Total Assessment is a certain percentage of the fair market value that is determined by local assessors to be the total taxable value of land and additions on the property. | Land | Improvement |
|---|---|---|---|---|
| 2025 | $3,399 | $286,000 | $175,945 | $110,055 |
| 2024 | $3,352 | $291,500 | $168,397 | $123,103 |
| 2023 | $3,168 | $503,000 | $262,686 | $240,314 |
| 2022 | $3,296 | $290,950 | $135,362 | $155,588 |
| 2021 | $3,103 | $426,000 | $222,491 | $203,509 |
| 2020 | $2,675 | $363,000 | $209,135 | $153,865 |
| 2019 | $2,709 | $363,000 | $184,243 | $178,757 |
| 2018 | $2,491 | $331,000 | $169,656 | $161,344 |
| 2016 | $2,210 | $165,825 | $74,433 | $91,392 |
| 2015 | $2,096 | $149,765 | $74,433 | $75,332 |
| 2014 | $1,859 | $136,721 | $74,433 | $62,288 |
| 2013 | -- | $146,150 | $56,227 | $89,923 |
Source: Public Records
Map
Nearby Homes
- 63 W 1750 N
- 1893 N 100 E
- 5 W Summerhill Ln
- 586 W 1950 N
- 136 W Summerhill Ln
- 283 W Summerhill Ln
- 354 S 525 W
- 393 S 525 W
- 374 S 525 W
- 373 S 525 W
- 386 S 525 W
- 286 W Summerhill Ln
- 687 W 2025 N
- 461 W Summerhill Ln
- 551 W Summerhill Ln
- 2132 N 725 W
- 2136 N 725 W
- 1549 N 400 W
- 1692 Willow Creek Cir
- 145 Ford Canyon Dr
Your Personal Tour Guide
Ask me questions while you tour the home.