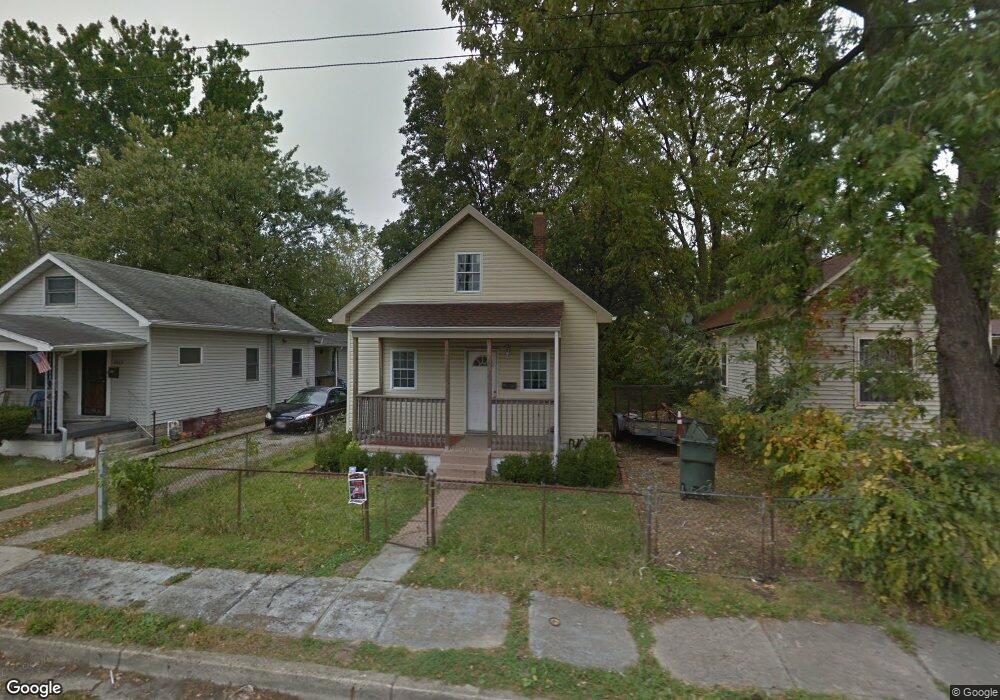
2870 E 9th Ave Columbus, OH 43219
Estimated Value: $97,000 - $158,000
2
Beds
1
Bath
748
Sq Ft
$165/Sq Ft
Est. Value
About This Home
This home is located at 2870 E 9th Ave, Columbus, OH 43219 and is currently estimated at $123,529, approximately $165 per square foot. 2870 E 9th Ave is a home located in Franklin County with nearby schools including East Columbus Elementary School, Champion Middle School, and East High School.
Ownership History
Date
Name
Owned For
Owner Type
Purchase Details
Closed on
Oct 31, 2018
Sold by
Morse Sarah
Bought by
Aburaida Properties Llc
Current Estimated Value
Purchase Details
Closed on
Jul 20, 2018
Sold by
Devin Stannky
Bought by
Malse Satah
Purchase Details
Closed on
Apr 19, 2017
Sold by
Collett Gregoga
Bought by
Stanley Dovn
Purchase Details
Closed on
Aug 12, 2008
Sold by
Fannie Mae
Bought by
Collett Gregory A
Purchase Details
Closed on
May 1, 2008
Sold by
Andrew Kevin J
Bought by
Federal National Mortgage Association
Purchase Details
Closed on
Jan 12, 2001
Sold by
Green Donald F
Bought by
Green Properties Llc
Purchase Details
Closed on
Nov 22, 2000
Sold by
Adams William H and Estate Of Alexander B Mcneil
Bought by
Green Donald F
Purchase Details
Closed on
Apr 4, 1972
Bought by
Mcneil Alexander B
Create a Home Valuation Report for This Property
The Home Valuation Report is an in-depth analysis detailing your home's value as well as a comparison with similar homes in the area
Home Values in the Area
Average Home Value in this Area
Purchase History
| Date | Buyer | Sale Price | Title Company |
|---|---|---|---|
| Aburaida Properties Llc | $15,000 | Valley Title & Escrow Agcy I | |
| Malse Satah | $32,200 | None Available | |
| Stanley Dovn | $9,000 | None Available | |
| Collett Gregory A | $7,000 | Title First | |
| Federal National Mortgage Association | $24,000 | None Available | |
| Green Properties Llc | -- | -- | |
| Green Donald F | $30,700 | Lawyers Title | |
| Mcneil Alexander B | -- | -- |
Source: Public Records
Tax History
| Year | Tax Paid | Tax Assessment Tax Assessment Total Assessment is a certain percentage of the fair market value that is determined by local assessors to be the total taxable value of land and additions on the property. | Land | Improvement |
|---|---|---|---|---|
| 2025 | $1,765 | $38,510 | $9,000 | $29,510 |
| 2024 | $1,765 | $38,510 | $9,000 | $29,510 |
| 2023 | $1,743 | $38,510 | $9,000 | $29,510 |
| 2022 | $675 | $12,710 | $1,610 | $11,100 |
| 2021 | $677 | $12,710 | $1,610 | $11,100 |
| 2020 | $678 | $12,710 | $1,610 | $11,100 |
| 2019 | $701 | $11,270 | $1,470 | $9,800 |
| 2018 | $800 | $11,270 | $1,470 | $9,800 |
| 2017 | $1,393 | $11,270 | $1,470 | $9,800 |
| 2016 | $2,366 | $12,750 | $2,140 | $10,610 |
| 2015 | $918 | $12,750 | $2,140 | $10,610 |
| 2014 | $769 | $12,750 | $2,140 | $10,610 |
| 2013 | $520 | $15,015 | $2,520 | $12,495 |
Source: Public Records
Map
Nearby Homes
- 2841 E 10th Ave
- 2864 E 10th Ave
- 2969 E 11th Ave
- 3001 E 12th Ave
- 2974 E 7th Ave
- 2827 E 6th Ave
- 3014 E 7th Ave
- 0 E 7th Ave Unit Lot 79 225013171
- 0 E 7th Ave Unit Lot 77 225013170
- 0 E 7th Ave Unit Lot 78 225013168
- 2798 E 5th Ave
- 00 E 7th Ave
- 0 E 5th Ave Unit 226008473
- 3123 E 13th Ave
- 2570 E 5th Ave
- 3237 E 12th Ave
- 629 N Dawson Ave
- 755 Stelzer Rd Unit 54
- 488 Stanbery Ave
- 343 N Cassady Ave
- 2864 E 9th Ave
- 2874 E 9th Ave
- 2860 E 9th Ave
- 2880 E 9th Ave
- 2854 E 9th Ave
- 2884 E 9th Ave
- 2850 E 9th Ave
- 2871 E 10th Ave
- 2883 E 10th Ave
- 0 Tenth Ave
- 2867 E 9th Ave
- 2873 E 9th Ave
- 2871 E 9th Ave Unit 873
- 2871 E 9th Ave Unit 2871-73
- 2861 E 9th Ave
- 2844 E 9th Ave
- 2877 E 9th Ave
- 2890 E 9th Ave
- 2857 E 9th Ave
- 2891 E 10th Ave
Your Personal Tour Guide
Ask me questions while you tour the home.