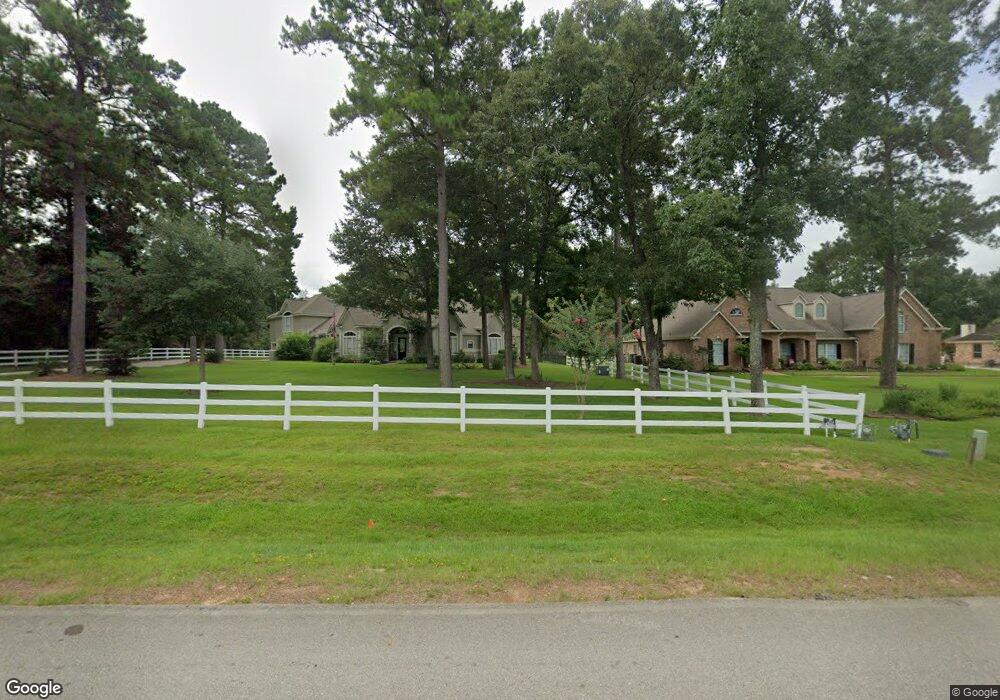
28702 Champion Way Magnolia, TX 77355
Estimated Value: $270,560 - $295,000
--
Bed
2
Baths
1,908
Sq Ft
$147/Sq Ft
Est. Value
About This Home
This home is located at 28702 Champion Way, Magnolia, TX 77355 and is currently estimated at $281,140, approximately $147 per square foot. 28702 Champion Way is a home located in Montgomery County with nearby schools including Cedric C Smith, Bear Branch Junior High School, and Magnolia High School.
Ownership History
Date
Name
Owned For
Owner Type
Purchase Details
Closed on
Feb 1, 2019
Sold by
Belera Scaife Gary and Belera Scaife
Bought by
Rodriguez Marco and Rodriguez Patricia
Current Estimated Value
Purchase Details
Closed on
Feb 16, 2010
Sold by
Fannie Mae
Bought by
Scaife Gary
Purchase Details
Closed on
Aug 10, 2009
Sold by
Lane Michael L and Lane Vickie L
Bought by
Scaife Gary K and Scaife Belera
Purchase Details
Closed on
Sep 28, 2001
Sold by
Frazier Ruth
Bought by
Lane Michael L and Lane Vicki L
Home Financials for this Owner
Home Financials are based on the most recent Mortgage that was taken out on this home.
Original Mortgage
$77,600
Interest Rate
6.88%
Purchase Details
Closed on
May 17, 1995
Sold by
Springer Delbert
Bought by
Frazier Ruth M
Create a Home Valuation Report for This Property
The Home Valuation Report is an in-depth analysis detailing your home's value as well as a comparison with similar homes in the area
Home Values in the Area
Average Home Value in this Area
Purchase History
| Date | Buyer | Sale Price | Title Company |
|---|---|---|---|
| Rodriguez Marco | -- | Providence Title Co | |
| Scaife Gary | -- | Lsi Title Agency Inc | |
| Scaife Gary K | -- | -- | |
| Lane Michael L | -- | Stewart Title | |
| Frazier Ruth M | -- | -- |
Source: Public Records
Mortgage History
| Date | Status | Borrower | Loan Amount |
|---|---|---|---|
| Previous Owner | Lane Michael L | $77,600 | |
| Closed | Lane Michael L | $14,550 |
Source: Public Records
Tax History Compared to Growth
Tax History
| Year | Tax Paid | Tax Assessment Tax Assessment Total Assessment is a certain percentage of the fair market value that is determined by local assessors to be the total taxable value of land and additions on the property. | Land | Improvement |
|---|---|---|---|---|
| 2025 | $3,087 | $195,000 | $37,761 | $157,239 |
| 2024 | $3,041 | $210,818 | $37,761 | $173,057 |
| 2023 | $3,041 | $192,600 | $37,760 | $154,840 |
| 2022 | $3,749 | $212,480 | $37,760 | $174,720 |
| 2021 | $2,323 | $125,000 | $37,760 | $87,240 |
| 2020 | $3,085 | $152,460 | $37,760 | $114,700 |
| 2019 | $2,921 | $145,050 | $37,760 | $107,290 |
| 2018 | $2,779 | $131,470 | $18,420 | $113,050 |
| 2017 | $2,789 | $131,510 | $18,420 | $113,090 |
| 2016 | $2,296 | $108,280 | $2,530 | $105,750 |
| 2015 | $1,713 | $102,920 | $2,530 | $100,390 |
| 2014 | $1,713 | $79,860 | $2,530 | $77,330 |
Source: Public Records
Map
Nearby Homes
- 28622 Champion Oaks Dr
- 28807 Hidden Cove Dr
- 28807 Champion Oaks Dr
- 28811 Champion Oaks Dr
- 9215 Water Front Ct
- 9227 Hidden Lake E
- 28918 Hidden Cove Dr
- 9210 Hidden Lake E
- 9210 E Lakeside Dr
- 9207 Hidden Ct
- 28935 Hidden Cove Dr
- 0 Hardin Store Unit 12393015
- 28303 Hardin Store Rd
- 28715 Fm 2978 Rd
- 28414 Dobbin Huffsmith Rd
- 29606 Aden
- 28536 Fm 2978 Rd
- 10 Heirloom Garden Place
- 28207 Dobbin Huffsmith Rd
- 207 N Vershire Cir
- 28702 Champion Oaks Dr
- 28706 Champion Oaks Dr
- 000 Champion Oaks Dr
- 0 Champion Oaks Dr
- Lot 3 Champion Oaks Dr
- Lot 2 Champion Oaks Dr
- 28703 Hidden Cove Dr
- 28707 Hidden Cove Dr
- 28714 Champion Way
- 28635 Hidden Cove Dr
- 28711 Hidden Cove Dr
- 28626 Champion Oaks Dr
- 28715 Hidden Cove Dr
- 28631 Hidden Cove Dr
- 28622 Champion Oaks Dr Unit OAKS
- 28719 Hidden Cove Dr
- 28627 Champion Oaks Dr
- 28627 Hidden Cove Dr
- 28719 Champion Way
- 28618 Champion Oaks Dr