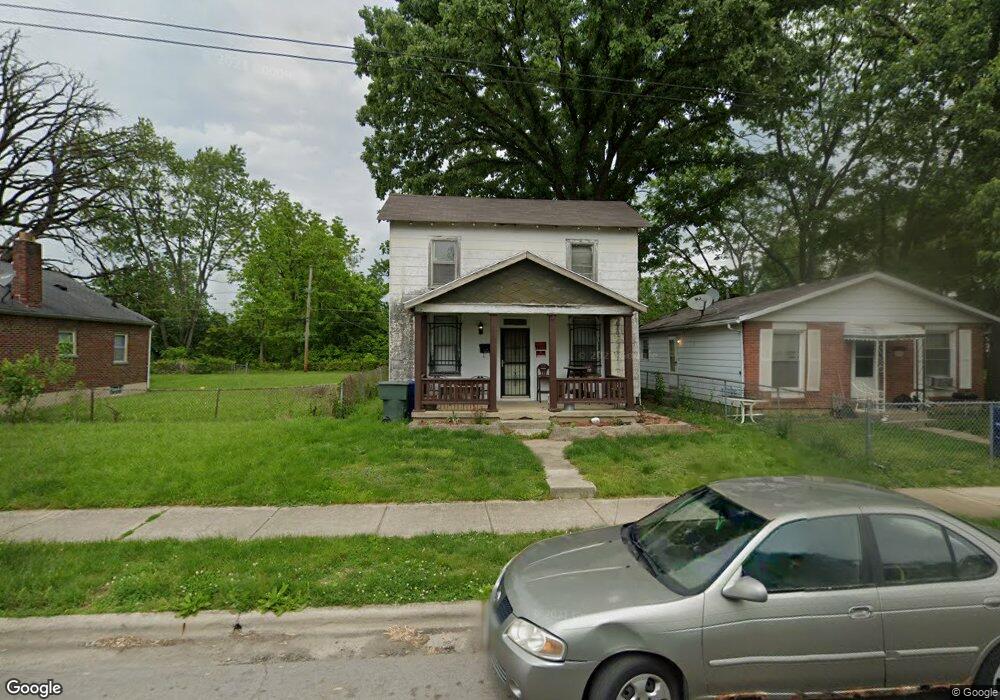
2872 E 6th Ave Columbus, OH 43219
Estimated Value: $140,000 - $207,502
2
Beds
1
Bath
1,000
Sq Ft
$170/Sq Ft
Est. Value
About This Home
This home is located at 2872 E 6th Ave, Columbus, OH 43219 and is currently estimated at $170,376, approximately $170 per square foot. 2872 E 6th Ave is a home located in Franklin County with nearby schools including East Columbus Elementary School, Champion Middle School, and East High School.
Ownership History
Date
Name
Owned For
Owner Type
Purchase Details
Closed on
Apr 18, 2024
Sold by
El Oufir Hicham
Bought by
Trevor Homes Llc
Current Estimated Value
Home Financials for this Owner
Home Financials are based on the most recent Mortgage that was taken out on this home.
Original Mortgage
$122,000
Interest Rate
6.79%
Mortgage Type
Construction
Purchase Details
Closed on
Apr 22, 2022
Sold by
Michelle Brown
Bought by
El Oufir Hicham
Purchase Details
Closed on
Apr 6, 2022
Sold by
Brown Michelle
Bought by
El Oufir Hicham
Purchase Details
Closed on
Oct 31, 2016
Sold by
Greenwood Jerry A and Greenwood Elizaebth
Bought by
Brown Michelle
Purchase Details
Closed on
Oct 12, 2006
Sold by
Estate Of Nellie J Greenwood
Bought by
Greenwood Jerry M
Purchase Details
Closed on
Nov 26, 1979
Bought by
Greenwood Jerry M
Create a Home Valuation Report for This Property
The Home Valuation Report is an in-depth analysis detailing your home's value as well as a comparison with similar homes in the area
Home Values in the Area
Average Home Value in this Area
Purchase History
| Date | Buyer | Sale Price | Title Company |
|---|---|---|---|
| Trevor Homes Llc | $78,000 | Empora Title | |
| El Oufir Hicham | $4,000 | Meyer Carl J | |
| El Oufir Hicham | $4,000 | Meyer Carl J | |
| Brown Michelle | $2,000 | None Available | |
| Greenwood Jerry M | -- | None Available | |
| Greenwood Jerry M | $18,900 | -- |
Source: Public Records
Mortgage History
| Date | Status | Borrower | Loan Amount |
|---|---|---|---|
| Closed | Trevor Homes Llc | $122,000 |
Source: Public Records
Tax History
| Year | Tax Paid | Tax Assessment Tax Assessment Total Assessment is a certain percentage of the fair market value that is determined by local assessors to be the total taxable value of land and additions on the property. | Land | Improvement |
|---|---|---|---|---|
| 2025 | $1,468 | $32,700 | $7,600 | $25,100 |
| 2024 | $1,468 | $32,700 | $7,600 | $25,100 |
| 2023 | $1,547 | $32,700 | $7,600 | $25,100 |
| 2022 | $341 | $6,580 | $1,260 | $5,320 |
| 2021 | $342 | $6,580 | $1,260 | $5,320 |
| 2020 | $342 | $6,580 | $1,260 | $5,320 |
| 2019 | $359 | $5,920 | $1,160 | $4,760 |
| 2018 | $391 | $5,920 | $1,160 | $4,760 |
| 2017 | $359 | $5,920 | $1,160 | $4,760 |
| 2016 | $466 | $7,040 | $1,890 | $5,150 |
| 2015 | $423 | $7,040 | $1,890 | $5,150 |
| 2014 | $424 | $7,040 | $1,890 | $5,150 |
| 2013 | $246 | $8,260 | $2,205 | $6,055 |
Source: Public Records
Map
Nearby Homes
- 2974 E 7th Ave
- 2996 E 6th Ave
- 0 E 7th Ave Unit Lot 79 225013171
- 0 E 7th Ave Unit Lot 77 225013170
- 0 E 7th Ave Unit Lot 78 225013168
- 00 E 7th Ave
- 2814 E 9th Ave
- 2841 E 10th Ave
- 2969 E 11th Ave
- 696 Northview Ave
- 2822 Bellwood Ave
- 3116 E 5th Ave
- 2599 E 5th Ave
- 2779 Columbus Ave
- 3123 E 13th Ave
- 343 N Cassady Ave
- 205 N Gould Rd
- 484 N Parkview Ave
- 161 N Gould Rd
- 2324 Ridgeway Ave
- 2876 E 6th Ave
- 2864 E 6th Ave
- 2860 E 6th Ave
- 2881 E 7th Ave
- 2852 E 6th Ave
- 2869 E 6th Ave
- 2865 E 6th Ave
- 0 E 7th Ave
- 2891 E 7th Ave
- 2861 E 6th Ave
- 2859 E 7th Ave
- 2883 E 6th Ave
- 2848 E 6th Ave
- 2857 E 6th Ave
- 2887 E 6th Ave
- 2849 E 6th Ave
- 2904 E 6th Ave Unit 2904
- 2904 E 6th Ave Unit 5 family
- 2904 E 6th Ave
- 2904 E 6th Ave
Your Personal Tour Guide
Ask me questions while you tour the home.