Estimated Value: $386,000 - $410,000
4
Beds
2
Baths
1,686
Sq Ft
$238/Sq Ft
Est. Value
About This Home
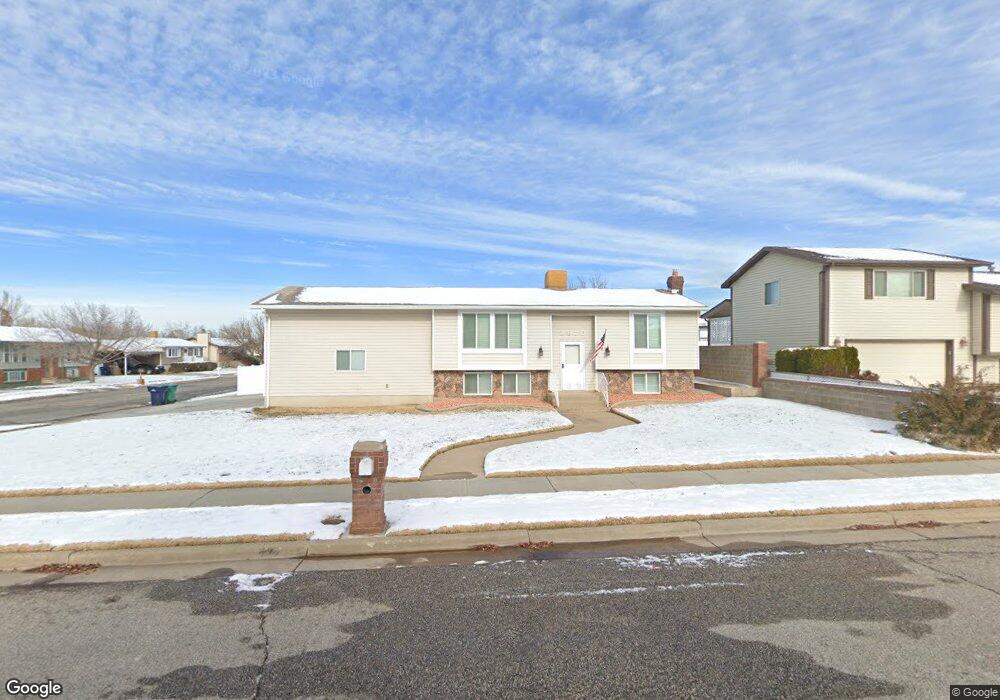
This home is located at 2872 W 5000 S, Roy, UT 84067 and is currently estimated at $401,356, approximately $238 per square foot. 2872 W 5000 S is a home located in Weber County with nearby schools including Midland School, Sand Ridge Junior High School, and Roy High School.
Ownership History
Date
Name
Owned For
Owner Type
Purchase Details
Closed on
Apr 15, 2022
Sold by
David Olsen Trust
Bought by
Blackhurst Jeffrey B
Current Estimated Value
Home Financials for this Owner
Home Financials are based on the most recent Mortgage that was taken out on this home.
Original Mortgage
$357,000
Outstanding Balance
$335,018
Interest Rate
4.16%
Mortgage Type
New Conventional
Estimated Equity
$66,338
Purchase Details
Closed on
Apr 14, 2022
Sold by
Blackhurst Jeffrey B
Bought by
Blackhurst Jeffrey B and Sewell Darius Jason
Home Financials for this Owner
Home Financials are based on the most recent Mortgage that was taken out on this home.
Original Mortgage
$357,000
Outstanding Balance
$335,018
Interest Rate
4.16%
Mortgage Type
New Conventional
Estimated Equity
$66,338
Purchase Details
Closed on
Jun 3, 2020
Sold by
Olsen David D
Bought by
The David Olsen Trusts
Create a Home Valuation Report for This Property
The Home Valuation Report is an in-depth analysis detailing your home's value as well as a comparison with similar homes in the area
Home Values in the Area
Average Home Value in this Area
Purchase History
| Date | Buyer | Sale Price | Title Company |
|---|---|---|---|
| Blackhurst Jeffrey B | -- | Old Republic Title | |
| Blackhurst Jeffrey B | -- | Stewart Title | |
| The David Olsen Trusts | -- | None Available |
Source: Public Records
Mortgage History
| Date | Status | Borrower | Loan Amount |
|---|---|---|---|
| Open | Blackhurst Jeffrey B | $357,000 |
Source: Public Records
Tax History
| Year | Tax Paid | Tax Assessment Tax Assessment Total Assessment is a certain percentage of the fair market value that is determined by local assessors to be the total taxable value of land and additions on the property. | Land | Improvement |
|---|---|---|---|---|
| 2025 | $2,271 | $353,824 | $131,826 | $221,998 |
| 2024 | $2,184 | $188,099 | $72,504 | $115,595 |
| 2023 | $2,065 | $177,650 | $66,315 | $111,335 |
| 2022 | $2,390 | $215,600 | $55,604 | $159,996 |
| 2021 | $2,040 | $303,000 | $75,808 | $227,192 |
| 2020 | $1,835 | $249,000 | $75,808 | $173,192 |
| 2019 | $1,764 | $225,000 | $45,669 | $179,331 |
| 2018 | $1,633 | $195,000 | $45,669 | $149,331 |
| 2017 | $1,509 | $168,000 | $45,669 | $122,331 |
| 2016 | $1,287 | $86,951 | $22,192 | $64,759 |
| 2015 | $1,161 | $80,568 | $22,192 | $58,376 |
| 2014 | $1,170 | $80,489 | $22,192 | $58,297 |
Source: Public Records
Map
Nearby Homes
Your Personal Tour Guide
Ask me questions while you tour the home.