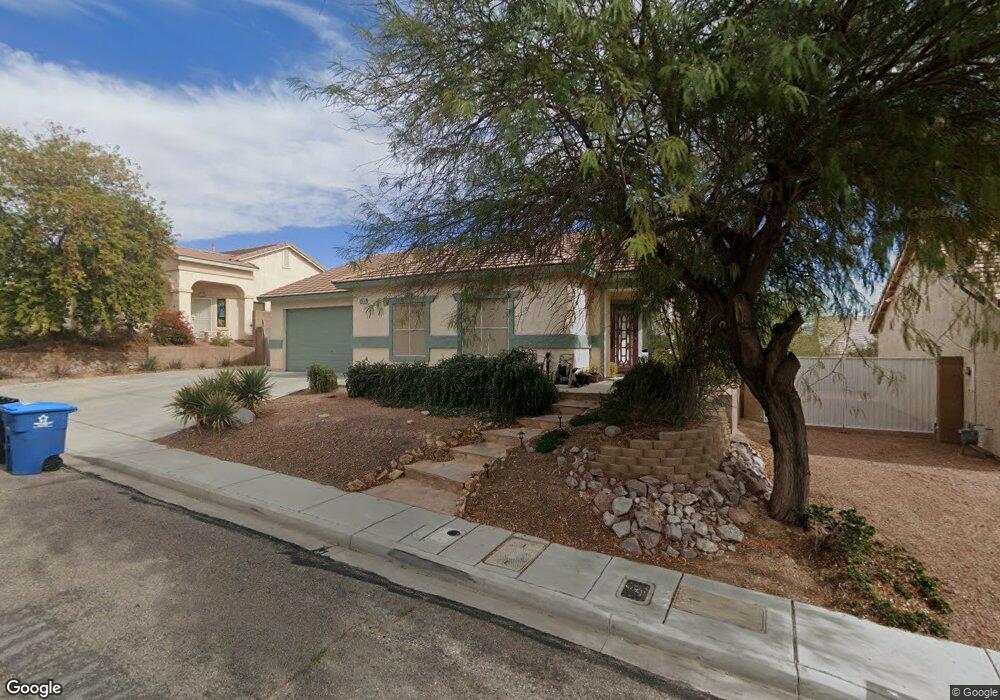
2874 Rippling Springs St Laughlin, NV 89029
Estimated Value: $327,000 - $353,000
2
Beds
2
Baths
1,541
Sq Ft
$217/Sq Ft
Est. Value
About This Home
This home is located at 2874 Rippling Springs St, Laughlin, NV 89029 and is currently estimated at $334,488, approximately $217 per square foot. 2874 Rippling Springs St is a home located in Clark County with nearby schools including William G. Bennett Elementary School.
Ownership History
Date
Name
Owned For
Owner Type
Purchase Details
Closed on
Aug 20, 2007
Sold by
Kellison Patrick J and Kellison Carey L
Bought by
Musa Philip
Current Estimated Value
Home Financials for this Owner
Home Financials are based on the most recent Mortgage that was taken out on this home.
Original Mortgage
$270,697
Outstanding Balance
$172,091
Interest Rate
6.74%
Mortgage Type
VA
Estimated Equity
$162,397
Purchase Details
Closed on
Aug 25, 2003
Sold by
Laughlin Llc
Bought by
Kellison Patrick J and Kellison Carey Lea
Home Financials for this Owner
Home Financials are based on the most recent Mortgage that was taken out on this home.
Original Mortgage
$130,106
Interest Rate
5.46%
Mortgage Type
VA
Create a Home Valuation Report for This Property
The Home Valuation Report is an in-depth analysis detailing your home's value as well as a comparison with similar homes in the area
Home Values in the Area
Average Home Value in this Area
Purchase History
| Date | Buyer | Sale Price | Title Company |
|---|---|---|---|
| Musa Philip | $265,000 | Lawyers Title Of Nevada | |
| Kellison Patrick J | $167,380 | United Title Of Nevada |
Source: Public Records
Mortgage History
| Date | Status | Borrower | Loan Amount |
|---|---|---|---|
| Open | Musa Philip | $270,697 | |
| Previous Owner | Kellison Patrick J | $130,106 |
Source: Public Records
Tax History Compared to Growth
Tax History
| Year | Tax Paid | Tax Assessment Tax Assessment Total Assessment is a certain percentage of the fair market value that is determined by local assessors to be the total taxable value of land and additions on the property. | Land | Improvement |
|---|---|---|---|---|
| 2025 | $1,976 | $87,424 | $17,500 | $69,924 |
| 2024 | $1,919 | $87,424 | $17,500 | $69,924 |
| 2023 | $1,919 | $91,831 | $25,900 | $65,931 |
| 2022 | $1,863 | $81,586 | $21,350 | $60,236 |
| 2021 | $1,809 | $78,539 | $21,350 | $57,189 |
| 2020 | $1,754 | $70,111 | $18,550 | $51,561 |
| 2019 | $1,703 | $64,319 | $15,750 | $48,569 |
| 2018 | $1,653 | $61,393 | $15,750 | $45,643 |
| 2017 | $1,929 | $57,601 | $15,750 | $41,851 |
| 2016 | $1,565 | $56,731 | $12,250 | $44,481 |
| 2015 | $1,561 | $58,286 | $11,200 | $47,086 |
| 2014 | $1,516 | $43,957 | $8,750 | $35,207 |
Source: Public Records
Map
Nearby Homes
- 2865 Rippling Springs St
- 2176 Camel Mesa Dr
- 2926 Shimmering Bay St
- 2852 Beacon Rock Dr
- 2888 Cattail Cove St
- 2194 Camel Mesa Dr
- 2157 Camel Mesa Dr
- 2175 Limestone Cove Ct
- 2078 Willow Bay Rd
- 2160 Highpointe Dr Unit 102
- 2225 Chandler Ranch Place
- 2180 Highpointe Dr Unit 203
- 2219 Rugged Mesa Dr
- 2223 Rugged Mesa Dr
- 2173 Aspen Mirror Way Unit 101
- 2200 Highpointe Dr Unit 201
- 2192 Aspen Mirror Way Unit 102
- 2772 Brinkley Manor St
- 2750 Beacon Rock Dr
- 2077 Alki Beach Ave
- 2884 Rippling Springs St
- 2864 Rippling Springs St
- 2875 Shimmering Bay St
- 2885 Shimmering Bay St
- 2865 Shimmering Bay St
- 2894 Rippling Springs St
- 2854 Rippling Springs St
- 2875 Rippling Springs St
- 2855 Shimmering Bay St
- 2895 Shimmering Bay St
- 2885 Rippling Springs St
- 2855 Rippling Springs St
- 2904 Rippling Springs St
- 2844 Rippling Springs St
- 2895 Rippling Springs St
- 2876 Shimmering Bay St
- 2866 Shimmering Bay St
- 2845 Shimmering Bay St
- 2886 Shimmering Bay St
- 2886 Shimmering Bay St Unit 2