Estimated Value: $376,399 - $436,000
3
Beds
1
Bath
1,255
Sq Ft
$322/Sq Ft
Est. Value
About This Home
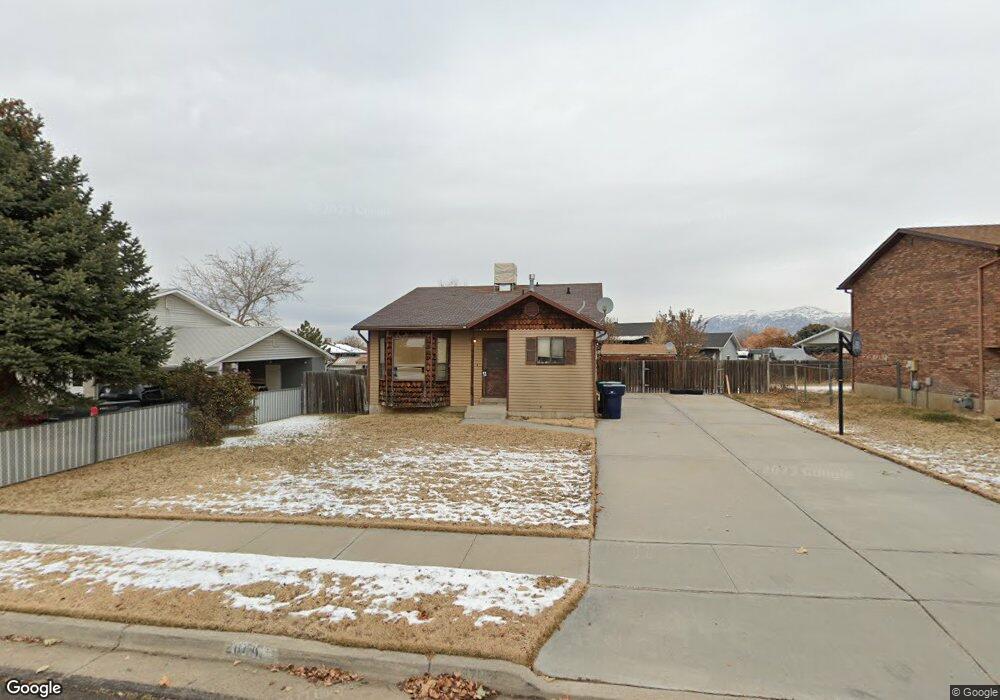
This home is located at 2874 W 4450 S, Roy, UT 84067 and is currently estimated at $404,100, approximately $321 per square foot. 2874 W 4450 S is a home located in Weber County with nearby schools including Midland School, Sand Ridge Junior High School, and Roy High School.
Ownership History
Date
Name
Owned For
Owner Type
Purchase Details
Closed on
Nov 28, 2017
Sold by
Barney Robert A
Bought by
Evert Hali Shannon
Current Estimated Value
Purchase Details
Closed on
Dec 18, 2012
Sold by
Barney Robert A
Bought by
Barney Robert A and Evert Hali Shannon
Home Financials for this Owner
Home Financials are based on the most recent Mortgage that was taken out on this home.
Original Mortgage
$77,838
Interest Rate
3.5%
Mortgage Type
FHA
Purchase Details
Closed on
Sep 9, 2008
Sold by
Marshburn Gregory Dalton
Bought by
Marshburn Terri Evert
Purchase Details
Closed on
Jan 24, 2003
Sold by
Marshburn Terri Evert and Evert Terri L
Bought by
Marshburn Terri Evert and Marshburn Gregory Dalton
Create a Home Valuation Report for This Property
The Home Valuation Report is an in-depth analysis detailing your home's value as well as a comparison with similar homes in the area
Home Values in the Area
Average Home Value in this Area
Purchase History
| Date | Buyer | Sale Price | Title Company |
|---|---|---|---|
| Evert Hali Shannon | -- | Accommodation | |
| Barney Robert A | -- | Inwest Title Ogden | |
| Barney Robert A | -- | Inwest Title Services Inc | |
| Marshburn Terri Evert | -- | None Available | |
| Marshburn Terri Evert | -- | -- |
Source: Public Records
Mortgage History
| Date | Status | Borrower | Loan Amount |
|---|---|---|---|
| Previous Owner | Barney Robert A | $77,838 |
Source: Public Records
Tax History Compared to Growth
Tax History
| Year | Tax Paid | Tax Assessment Tax Assessment Total Assessment is a certain percentage of the fair market value that is determined by local assessors to be the total taxable value of land and additions on the property. | Land | Improvement |
|---|---|---|---|---|
| 2025 | $2,107 | $324,846 | $126,155 | $198,691 |
| 2024 | $2,060 | $175,999 | $69,385 | $106,614 |
| 2023 | $1,998 | $171,050 | $70,326 | $100,724 |
| 2022 | $2,087 | $185,350 | $59,551 | $125,799 |
| 2021 | $1,816 | $266,000 | $73,276 | $192,724 |
| 2020 | $1,756 | $237,000 | $73,276 | $163,724 |
| 2019 | $1,694 | $215,000 | $43,596 | $171,404 |
| 2018 | $1,566 | $186,000 | $43,596 | $142,404 |
| 2017 | $1,517 | $169,000 | $41,653 | $127,347 |
| 2016 | $1,412 | $84,033 | $24,255 | $59,778 |
| 2015 | $1,280 | $77,492 | $24,255 | $53,237 |
| 2014 | $1,245 | $74,278 | $24,255 | $50,023 |
Source: Public Records
Map
Nearby Homes
- 2816 W 4400 S
- 2802 W 4375 S
- 4635 S 2950 W
- 2979 W 4275 S
- 2835 W 4200 S
- 3084 W 4375 S
- 2642 W 4400 S
- 3014 W 4750 S
- 2777 W 4175 S Unit 229
- 2778 W 4175 S Unit 235
- 1952 W 5450 S
- 3046 W 4850 S
- 4670 S 2525 W
- 4440 Stone Creek Rd Unit 2E
- 4891 S 2875 W
- 4118 Westlake Dr
- 4875 S 2675 W
- 4022 S 2725 W
- 4510 Stone Creek Rd Unit F
- 4918 S 2925 W