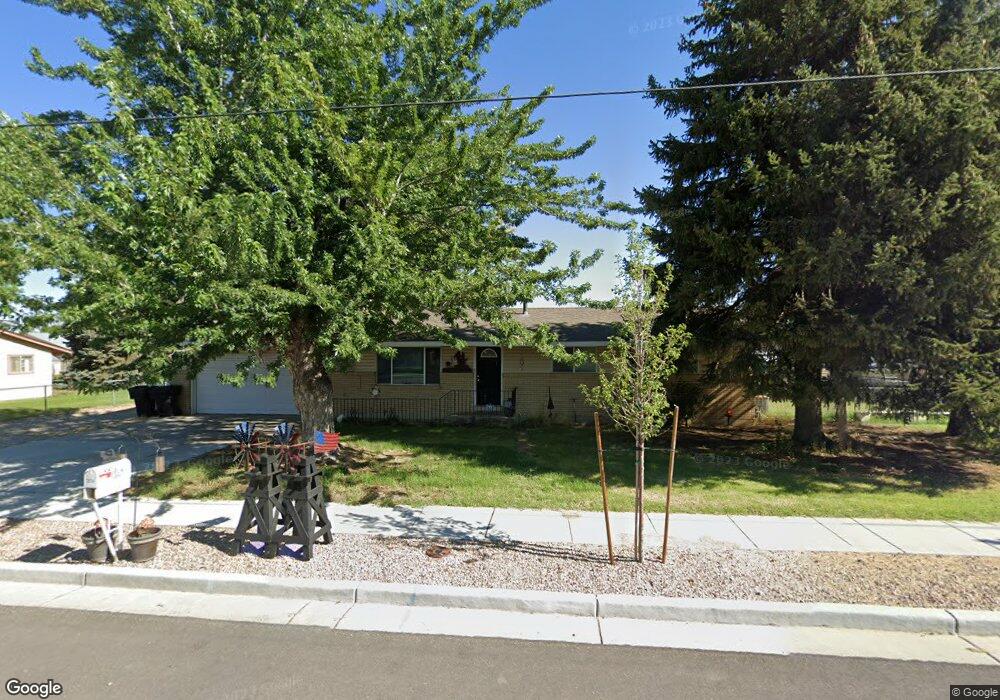
2874 W 800 N Clearfield, UT 84015
Estimated Value: $453,000 - $506,000
3
Beds
2
Baths
1,250
Sq Ft
$374/Sq Ft
Est. Value
About This Home
This home is located at 2874 W 800 N, Clearfield, UT 84015 and is currently estimated at $467,594, approximately $374 per square foot. 2874 W 800 N is a home located in Davis County with nearby schools including Lakeside School, West Point Junior High School, and Syracuse High School.
Ownership History
Date
Name
Owned For
Owner Type
Purchase Details
Closed on
Dec 11, 2002
Sold by
Hud
Bought by
Tubbs Monty J and Tubbs Gerilyn
Current Estimated Value
Home Financials for this Owner
Home Financials are based on the most recent Mortgage that was taken out on this home.
Original Mortgage
$112,646
Outstanding Balance
$47,217
Interest Rate
6.03%
Estimated Equity
$420,377
Purchase Details
Closed on
Sep 18, 2002
Sold by
Wells Fargo Home Mtg Inc
Bought by
Hud
Purchase Details
Closed on
Sep 17, 2002
Sold by
Castillo Graciela S
Bought by
Wells Fargo Home Mtg Inc
Purchase Details
Closed on
Feb 16, 2001
Sold by
Wooten John L
Bought by
Castillo Graciela S
Home Financials for this Owner
Home Financials are based on the most recent Mortgage that was taken out on this home.
Original Mortgage
$125,923
Interest Rate
7.08%
Mortgage Type
FHA
Create a Home Valuation Report for This Property
The Home Valuation Report is an in-depth analysis detailing your home's value as well as a comparison with similar homes in the area
Home Values in the Area
Average Home Value in this Area
Purchase History
| Date | Buyer | Sale Price | Title Company |
|---|---|---|---|
| Tubbs Monty J | -- | Us Title | |
| Hud | -- | Backman Stewart Title Servic | |
| Wells Fargo Home Mtg Inc | $138,095 | Backman Stewart Title Servic | |
| Castillo Graciela S | -- | Us Title |
Source: Public Records
Mortgage History
| Date | Status | Borrower | Loan Amount |
|---|---|---|---|
| Open | Tubbs Monty J | $112,646 | |
| Previous Owner | Castillo Graciela S | $125,923 |
Source: Public Records
Tax History Compared to Growth
Tax History
| Year | Tax Paid | Tax Assessment Tax Assessment Total Assessment is a certain percentage of the fair market value that is determined by local assessors to be the total taxable value of land and additions on the property. | Land | Improvement |
|---|---|---|---|---|
| 2025 | $2,259 | $217,250 | $161,719 | $55,531 |
| 2024 | $2,231 | $215,599 | $168,330 | $47,269 |
| 2023 | $2,041 | $200,750 | $114,564 | $86,185 |
| 2022 | $2,157 | $388,000 | $195,846 | $192,154 |
| 2021 | $1,962 | $288,000 | $169,194 | $118,806 |
| 2020 | $1,728 | $251,000 | $165,609 | $85,391 |
| 2019 | $1,642 | $233,000 | $154,630 | $78,370 |
| 2018 | $1,514 | $211,000 | $126,161 | $84,839 |
| 2016 | $1,325 | $95,370 | $53,063 | $42,307 |
| 2015 | $1,270 | $86,900 | $53,063 | $33,837 |
| 2014 | $1,162 | $80,805 | $53,063 | $27,742 |
| 2013 | -- | $91,568 | $38,133 | $53,435 |
Source: Public Records
Map
Nearby Homes