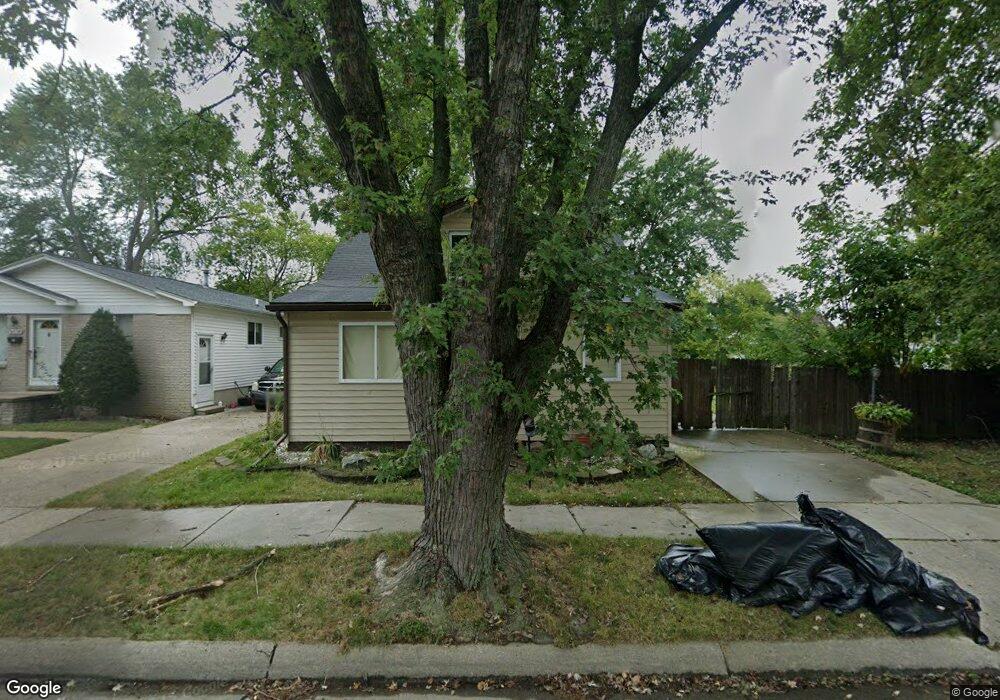
28743 Hillview St Roseville, MI 48066
Estimated Value: $155,000 - $191,000
3
Beds
2
Baths
1,484
Sq Ft
$117/Sq Ft
Est. Value
About This Home
This home is located at 28743 Hillview St, Roseville, MI 48066 and is currently estimated at $174,270, approximately $117 per square foot. 28743 Hillview St is a home located in Macomb County with nearby schools including Fountain Elementary School, Roseville Middle School, and Eastland Middle School.
Ownership History
Date
Name
Owned For
Owner Type
Purchase Details
Closed on
Jan 22, 2025
Sold by
Roland Kevin and Stahl Curt
Bought by
Dfo Rule One Llc
Current Estimated Value
Purchase Details
Closed on
Jun 4, 2024
Sold by
Maley Charles
Bought by
Roland Kevin and Stahl Curt
Purchase Details
Closed on
Jan 20, 2011
Sold by
Stahl Curt and Stahl Shelley
Bought by
Maley Charles
Purchase Details
Closed on
Oct 7, 2010
Sold by
Taranto Sheena
Bought by
Stark Shelley and Stark Curt
Purchase Details
Closed on
Oct 21, 2009
Sold by
Stahl Shelley and Stahl Curt
Bought by
Taranto Sheena
Purchase Details
Closed on
Jan 11, 2008
Sold by
Capron Kimberly and Raab Frank
Bought by
Stahl Shelley and Stahl Curt
Purchase Details
Closed on
Apr 28, 2003
Sold by
Capron Kimberly
Bought by
Capron Kimberly and Raab Frank
Create a Home Valuation Report for This Property
The Home Valuation Report is an in-depth analysis detailing your home's value as well as a comparison with similar homes in the area
Home Values in the Area
Average Home Value in this Area
Purchase History
| Date | Buyer | Sale Price | Title Company |
|---|---|---|---|
| Dfo Rule One Llc | -- | None Listed On Document | |
| Dfo Rule One Llc | -- | None Listed On Document | |
| Roland Kevin | $68,000 | None Listed On Document | |
| Roland Kevin | $68,000 | None Listed On Document | |
| Maley Charles | $58,000 | Abstract Title | |
| Maley Charles | $58,000 | Abstract Title | |
| Maley Charles | -- | Abstract Title Agency | |
| Stark Shelley | -- | Philip F Greco Title Company | |
| Taranto Sheena | -- | Capital Title Insurance Agen | |
| Stahl Shelley | -- | Chicago Title Insurance Co | |
| Capron Kimberly | -- | Philip F Greco Title Company |
Source: Public Records
Tax History Compared to Growth
Tax History
| Year | Tax Paid | Tax Assessment Tax Assessment Total Assessment is a certain percentage of the fair market value that is determined by local assessors to be the total taxable value of land and additions on the property. | Land | Improvement |
|---|---|---|---|---|
| 2025 | $3,779 | $80,300 | $0 | $0 |
| 2024 | $1,978 | $72,100 | $0 | $0 |
| 2023 | $1,936 | $62,400 | $0 | $0 |
| 2022 | $3,388 | $52,600 | $0 | $0 |
| 2021 | $3,287 | $44,600 | $0 | $0 |
| 2020 | $1,201 | $42,300 | $0 | $0 |
| 2019 | $1,324 | $39,000 | $0 | $0 |
| 2018 | $1,427 | $0 | $0 | $0 |
| 2017 | $1,427 | $31,025 | $5,110 | $25,915 |
| 2016 | $1,324 | $31,025 | $0 | $0 |
| 2015 | $908 | $25,946 | $0 | $0 |
| 2013 | -- | $27,155 | $0 | $0 |
| 2011 | -- | $32,514 | $0 | $0 |
Source: Public Records
Map
Nearby Homes
- 28511 Hillview St
- 28908 Maple St
- 28767 Maple St
- 29030 Utica Rd
- 17970 Lincoln Dr
- 28780 Waverly St
- 28399 Felician St
- 4 Belleair Vacant St
- 16550-16552 & 16530- Petrie St
- 28320 Waverly St
- 17980 Homer St
- 28435 Victor St
- 18030 Homer St
- 28436 Victor St
- 28041 Essex St
- 18022 Elizabeth St
- 28720 Bohn St
- 28410 Bohn St
- 27962 Eastwick Square
- 27920 Eastwick Square
- 28739 Hillview St
- 28735 Hillview St
- 28809 Hillview St
- 28780 Essex St
- 28742 Hillview St
- 28744 Essex St
- 28736 Hillview St
- 28800 Essex St
- 28760 Hillview St
- 28736 Essex St
- 28727 Hillview St
- 28808 Essex St
- 28780 Hillview St
- 28821 Hillview St
- 28728 Hillview St
- 28728 Essex St
- 28816 Essex St
- 28800 Hillview St
- 28725 Hillview St
- 28739 Pinehurst St