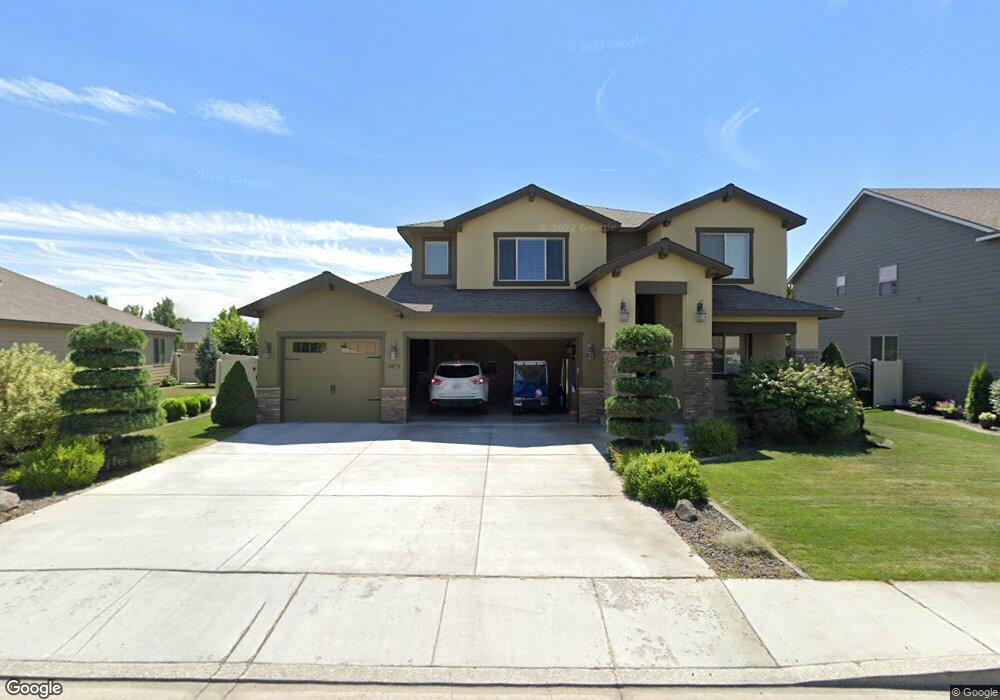
2875 Crosswater Loop Richland, WA 99354
Estimated Value: $575,000 - $620,000
4
Beds
3
Baths
2,764
Sq Ft
$215/Sq Ft
Est. Value
About This Home
This home is located at 2875 Crosswater Loop, Richland, WA 99354 and is currently estimated at $594,923, approximately $215 per square foot. 2875 Crosswater Loop is a home located in Benton County with nearby schools including Sacajawea Elementary School, Chief Joseph Middle School, and Hanford High School.
Ownership History
Date
Name
Owned For
Owner Type
Purchase Details
Closed on
Oct 28, 2020
Sold by
Wright Tomy L and Elliott Tomy L
Bought by
Wright Gavin T
Current Estimated Value
Home Financials for this Owner
Home Financials are based on the most recent Mortgage that was taken out on this home.
Original Mortgage
$227,001
Outstanding Balance
$199,681
Interest Rate
2.8%
Mortgage Type
New Conventional
Estimated Equity
$395,242
Purchase Details
Closed on
Aug 17, 2010
Sold by
Pahlisch Homes Inc
Bought by
Wright Gavin T and Elliott Tomy L
Home Financials for this Owner
Home Financials are based on the most recent Mortgage that was taken out on this home.
Original Mortgage
$269,600
Interest Rate
4.51%
Mortgage Type
New Conventional
Purchase Details
Closed on
Nov 23, 2009
Sold by
North Stone Richland Llc
Bought by
Pahlisch Homes Inc
Home Financials for this Owner
Home Financials are based on the most recent Mortgage that was taken out on this home.
Original Mortgage
$45,000
Interest Rate
4.88%
Mortgage Type
Unknown
Create a Home Valuation Report for This Property
The Home Valuation Report is an in-depth analysis detailing your home's value as well as a comparison with similar homes in the area
Home Values in the Area
Average Home Value in this Area
Purchase History
| Date | Buyer | Sale Price | Title Company |
|---|---|---|---|
| Wright Gavin T | -- | None Available | |
| Wright Gavin T | $337,000 | Stewart Title Co 1 | |
| Pahlisch Homes Inc | $52,500 | Stewart Title Co 1 |
Source: Public Records
Mortgage History
| Date | Status | Borrower | Loan Amount |
|---|---|---|---|
| Open | Wright Gavin T | $227,001 | |
| Closed | Wright Gavin T | $269,600 | |
| Previous Owner | Pahlisch Homes Inc | $45,000 | |
| Previous Owner | Pahlisch Homes Inc | $137,250 |
Source: Public Records
Tax History
| Year | Tax Paid | Tax Assessment Tax Assessment Total Assessment is a certain percentage of the fair market value that is determined by local assessors to be the total taxable value of land and additions on the property. | Land | Improvement |
|---|---|---|---|---|
| 2025 | $5,384 | $595,220 | $80,000 | $515,220 |
| 2024 | $5,484 | $579,170 | $70,000 | $509,170 |
| 2023 | $5,484 | $587,250 | $70,000 | $517,250 |
| 2022 | $4,694 | $474,100 | $70,000 | $404,100 |
| 2021 | $4,516 | $425,610 | $70,000 | $355,610 |
| 2020 | $4,777 | $393,280 | $70,000 | $323,280 |
| 2019 | $4,406 | $393,280 | $70,000 | $323,280 |
| 2018 | $4,507 | $390,960 | $52,000 | $338,960 |
| 2017 | $3,982 | $334,470 | $52,000 | $282,470 |
| 2016 | $3,924 | $334,470 | $52,000 | $282,470 |
| 2015 | $3,999 | $334,470 | $52,000 | $282,470 |
| 2014 | -- | $334,470 | $52,000 | $282,470 |
| 2013 | -- | $334,470 | $52,000 | $282,470 |
Source: Public Records
Map
Nearby Homes
- 2818 Tuscanna Dr
- 2935 Crosswater Loop
- 2815 Riverbend Dr
- 2312 Coppercreek St
- 2601 Eagle Watch Loop
- 2971 Sonoran Dr
- 2940 Sedona Cir
- 2624 Eagle Watch Loop
- 2665 Maidstone St
- 2557 Logan St
- 2981 Redrock Ridge Loop
- 3020 Redrock Ridge Loop
- 2772 Grayhawk Loop
- 3294 Wild Canyon Way
- 3359 Village Pkwy
- 3216 Wild Canyon Way
- 3170 Mountain Quail Ln
- 3182 Mountain Quail Ln
- 3010 Hyde Rd
- 3263 Emory Ave
- 2881 Crosswater Loop
- 2867 Crosswater Loop
- 2887 Crosswater Loop
- 2887 Crosswater Loop
- 2870 Crosswater Loop
- 2861 Crosswater Loop
- 2861 Crosswater Loop Unit Beautifully Landscap
- 2861 Crosswater Loop
- 2876 Crosswater Loop
- 2876 Crosswater Loop Unit Gorgeous Horn Rapids
- 2876 Crosswater Loop Unit Gorgeous Horn Rapids
- 2864 Crosswater Loop
- 2882 Crosswater Loop
- 2893 Crosswater Loop
- 2855 Crosswater Loop
- 2443 Bramasole Drive Way
- 2449 Bramasole Drive Way
- 2888 Crosswater Loop
- 2455 Bramasole Drive Way
- 2858 Crosswater Loop
Your Personal Tour Guide
Ask me questions while you tour the home.