Estimated Value: $55,000 - $207,000
Studio
2
Baths
1,329
Sq Ft
$94/Sq Ft
Est. Value
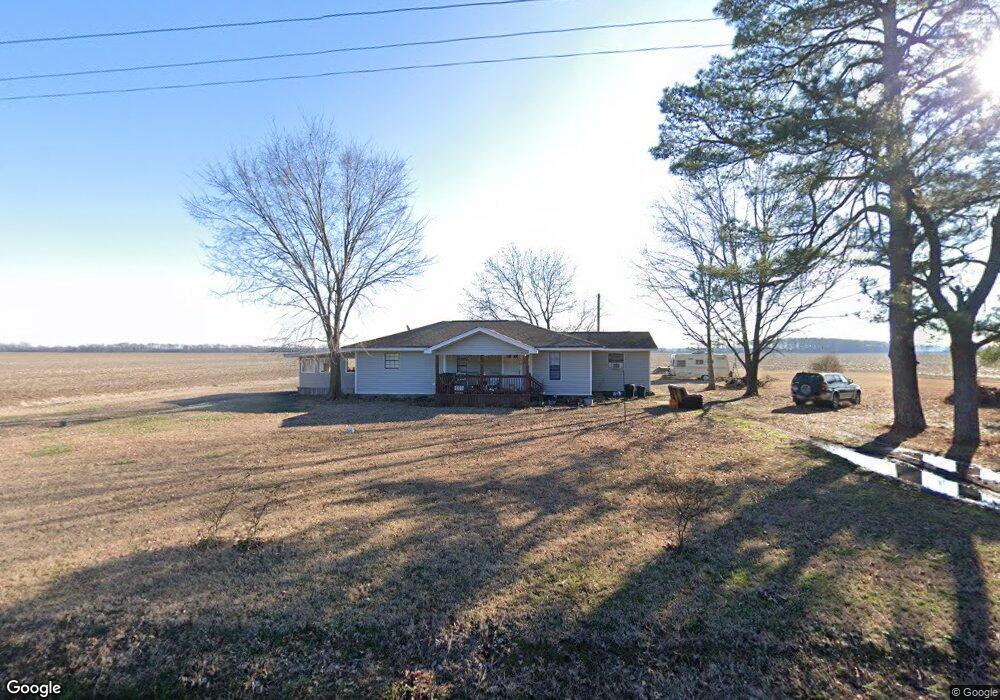
About This Home
This home is located at 2875 Johnson Rd, Scott, AR 72142 and is currently estimated at $125,567, approximately $94 per square foot. 2875 Johnson Rd is a home located in Lonoke County with nearby schools including England Elementary School and England High School.
Ownership History
Date
Name
Owned For
Owner Type
Purchase Details
Closed on
Aug 29, 2025
Sold by
Joan Yvonne Miller Living Trust and Miller Joan Yvonne
Bought by
Kumpe Living Trust and Hinson
Current Estimated Value
Purchase Details
Closed on
Jun 6, 2025
Sold by
Miller Joan and Dollar Judy
Bought by
Joan Yvonne Miller Living Trust and Miller
Purchase Details
Closed on
Apr 20, 2018
Sold by
Brasfield Mark and Brasfield Cathy E
Bought by
Horner William
Home Financials for this Owner
Home Financials are based on the most recent Mortgage that was taken out on this home.
Original Mortgage
$82,000
Interest Rate
4.45%
Mortgage Type
New Conventional
Purchase Details
Closed on
Jul 17, 1991
Bought by
Ronnie Martin
Purchase Details
Closed on
Oct 18, 1985
Bought by
Ronnie Martin and Ronnie Wife
Create a Home Valuation Report for This Property
The Home Valuation Report is an in-depth analysis detailing your home's value as well as a comparison with similar homes in the area
Purchase History
| Date | Buyer | Sale Price | Title Company |
|---|---|---|---|
| Kumpe Living Trust | $50,000 | Professional Land Title Compan | |
| Joan Yvonne Miller Living Trust | -- | Professional Land Title Compan | |
| Horner William | $82,000 | Attorney'S Title | |
| Ronnie Martin | -- | -- | |
| Ronnie Martin | $5,000 | -- |
Source: Public Records
Mortgage History
| Date | Status | Borrower | Loan Amount |
|---|---|---|---|
| Previous Owner | Horner William | $82,000 |
Source: Public Records
Tax History
| Year | Tax Paid | Tax Assessment Tax Assessment Total Assessment is a certain percentage of the fair market value that is determined by local assessors to be the total taxable value of land and additions on the property. | Land | Improvement |
|---|---|---|---|---|
| 2025 | $301 | $12,680 | $900 | $11,780 |
| 2024 | $301 | $12,680 | $900 | $11,780 |
| 2023 | $301 | $12,680 | $900 | $11,780 |
| 2022 | $333 | $12,680 | $900 | $11,780 |
| 2021 | $297 | $12,680 | $900 | $11,780 |
| 2020 | $267 | $11,210 | $900 | $10,310 |
| 2019 | $267 | $11,210 | $900 | $10,310 |
| 2018 | $586 | $11,210 | $900 | $10,310 |
| 2017 | $531 | $11,210 | $900 | $10,310 |
| 2016 | $236 | $11,210 | $900 | $10,310 |
| 2015 | $553 | $12,820 | $900 | $11,920 |
| 2014 | $220 | $12,820 | $900 | $11,920 |
Source: Public Records
Map
Nearby Homes
- 3078 Johnson Rd
- 000 Cole Dealing Rd
- 10642 Hwy 165 W
- 1070 Mound View Dr
- 995 Mound View Dr
- Lot 330 Mound View Dr
- Lot 317 Mound View Dr
- Lot 322 Mound View Dr
- Lot 309 Mound View Dr
- Lot 323 Mound View Dr
- Lot 303 Mound View Dr
- Lot 321 Mound View Dr
- Lot 306 Mound View Dr
- Lot 326 Mound View Dr
- Lot 73 Mound View Dr
- Lot 329 Mound View Dr
- Lot 74 Mound View Dr
- Lot 334 Mound View Dr
- Lot 320 Mound View Dr
- Lot 305 Mound View Dr
- 2640 Johnson Rd
- 3065 Johnson Rd
- 0 Johnson Rd Unit 16036409
- 0 Johnson Rd Unit 15016018
- 0 Johnson Rd Unit 20024694
- 0 Johnson Rd Unit 19038104
- 3185 Johnson Rd
- 3250 Johnson Rd
- 3282 Johnson Rd
- 3454 Johnson Rd
- 3498 Johnson Rd
- 1425 Cole Deading Rd
- 1483 Cole Deading Rd
- 1353 Cole Deading Rd
- 00 Johnson Rd
- 000 Cole Dealing Rd Unit LotWP001
- 1075 Cole Deading Rd
- 0 Henson Ln Unit 16020965
- 2194 Cole Deading Rd
- 2194 Cole Deading Rd
Your Personal Tour Guide
Ask me questions while you tour the home.