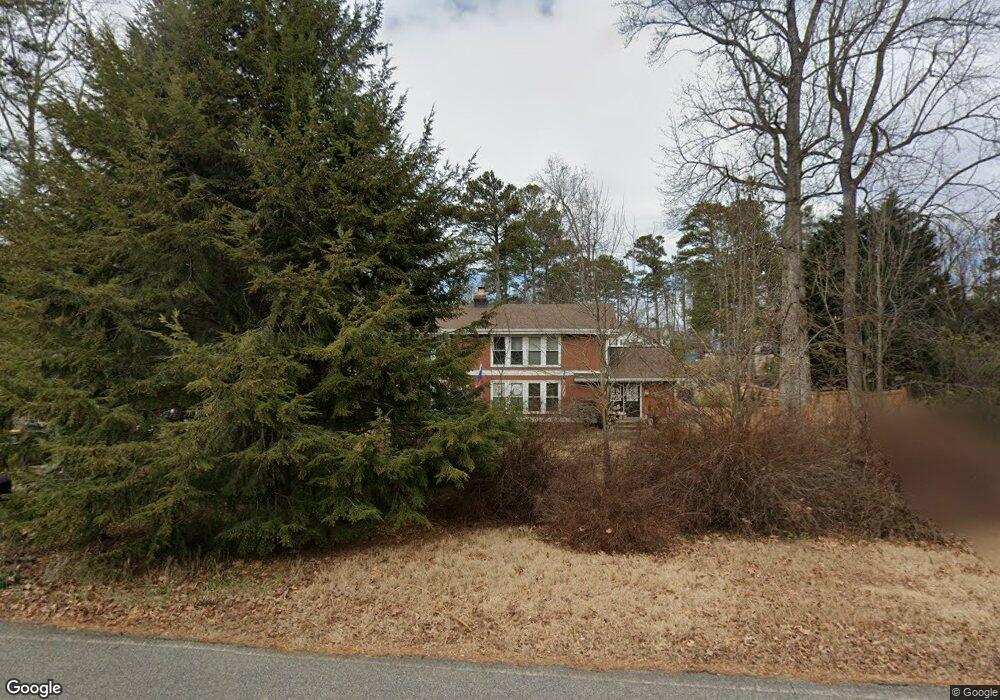
2875 Pinetree Rd Cumming, GA 30041
Estimated Value: $473,663 - $500,000
3
Beds
3
Baths
3,972
Sq Ft
$123/Sq Ft
Est. Value
About This Home
This home is located at 2875 Pinetree Rd, Cumming, GA 30041 and is currently estimated at $486,666, approximately $122 per square foot. 2875 Pinetree Rd is a home located in Forsyth County with nearby schools including Mashburn Elementary School, Lakeside Middle School, and Forsyth Central High School.
Ownership History
Date
Name
Owned For
Owner Type
Purchase Details
Closed on
Aug 9, 2011
Sold by
Mitchell Timothy M
Bought by
Mitchell Timothy M and Murphy Eileen F
Current Estimated Value
Home Financials for this Owner
Home Financials are based on the most recent Mortgage that was taken out on this home.
Original Mortgage
$165,690
Outstanding Balance
$112,581
Interest Rate
4.25%
Mortgage Type
FHA
Estimated Equity
$374,085
Purchase Details
Closed on
Jul 15, 2011
Sold by
Taylor Catherine
Bought by
Mitchell Timothy M
Home Financials for this Owner
Home Financials are based on the most recent Mortgage that was taken out on this home.
Original Mortgage
$165,690
Outstanding Balance
$112,581
Interest Rate
4.25%
Mortgage Type
FHA
Estimated Equity
$374,085
Purchase Details
Closed on
Sep 17, 1993
Sold by
Medlin James B
Bought by
Wyke Timothy B
Home Financials for this Owner
Home Financials are based on the most recent Mortgage that was taken out on this home.
Original Mortgage
$93,350
Interest Rate
7.19%
Mortgage Type
FHA
Create a Home Valuation Report for This Property
The Home Valuation Report is an in-depth analysis detailing your home's value as well as a comparison with similar homes in the area
Home Values in the Area
Average Home Value in this Area
Purchase History
| Date | Buyer | Sale Price | Title Company |
|---|---|---|---|
| Mitchell Timothy M | -- | -- | |
| Mitchell Timothy M | $170,000 | -- | |
| Wyke Timothy B | $95,400 | -- |
Source: Public Records
Mortgage History
| Date | Status | Borrower | Loan Amount |
|---|---|---|---|
| Open | Mitchell Timothy M | $165,690 | |
| Closed | Mitchell Timothy M | $170,000 | |
| Previous Owner | Wyke Timothy B | $93,350 |
Source: Public Records
Tax History Compared to Growth
Tax History
| Year | Tax Paid | Tax Assessment Tax Assessment Total Assessment is a certain percentage of the fair market value that is determined by local assessors to be the total taxable value of land and additions on the property. | Land | Improvement |
|---|---|---|---|---|
| 2025 | $3,248 | $160,516 | $58,000 | $102,516 |
| 2024 | $3,248 | $164,916 | $54,000 | $110,916 |
| 2023 | $2,665 | $151,776 | $40,000 | $111,776 |
| 2022 | $2,682 | $103,888 | $24,000 | $79,888 |
| 2021 | $2,528 | $103,888 | $24,000 | $79,888 |
| 2020 | $2,413 | $98,288 | $16,000 | $82,288 |
| 2019 | $2,343 | $94,716 | $18,000 | $76,716 |
| 2018 | $2,157 | $85,316 | $18,000 | $67,316 |
| 2017 | $1,849 | $70,316 | $18,000 | $52,316 |
| 2016 | $1,806 | $68,316 | $16,000 | $52,316 |
| 2015 | $1,701 | $64,316 | $12,000 | $52,316 |
| 2014 | $1,501 | $59,996 | $0 | $0 |
Source: Public Records
Map
Nearby Homes
- 2995 Hamilton Rd
- 2935 Hamilton Rd Unit IV
- 3235 Southshore Ct
- 3705 Tradewinds Dr
- 3706 Tradewinds Dr
- 2835 Evan Manor Ln
- 3200 Rim Cove Dr Unit 172
- 3200 Rim Cove Dr Unit 116
- 2730 Brook Valley Dr
- 2575 Maple Park Place
- LOT 51 Brook Valley Dr
- LOT 50 Brook Valley Dr
- LOT 48 Brook Valley Dr
- LOT 52 Brook Valley Dr
- LOT 47 Brook Valley Dr
- LOT 54 Brook Valley Dr
- 2802 Buford Dam Rd
- 2765 Port Bow Ln
- 2735 Hanson Ct
- 3430 Lake Shore Dr
- 2865 Pinetree Rd Unit IV
- 2905 Pinetree Rd
- 2970 Hamilton Rd
- 2970 Hamilton Rd Unit IV
- 2855 Pinetree Rd
- 2935 Pinetree Rd
- 2960 Hamilton Rd
- 2880 Pinetree Rd
- 2845 Pinetree Rd Unit IV
- 2870 Pinetree Rd Unit 4
- 2940 Hamilton Rd Unit 43
- 2940 Hamilton Rd Unit IV
- 2860 Pinetree Rd
- 0 Hamilton Rd Unit 7288908
- 0 Hamilton Rd Unit 10213371
- ) Hamilton Rd
- 0 Hamilton Rd Unit 10191637
- 0 Hamilton Rd Unit 7256603
- 0 Hamilton Rd Unit 8726018
- 0 Hamilton Rd Unit 3199416