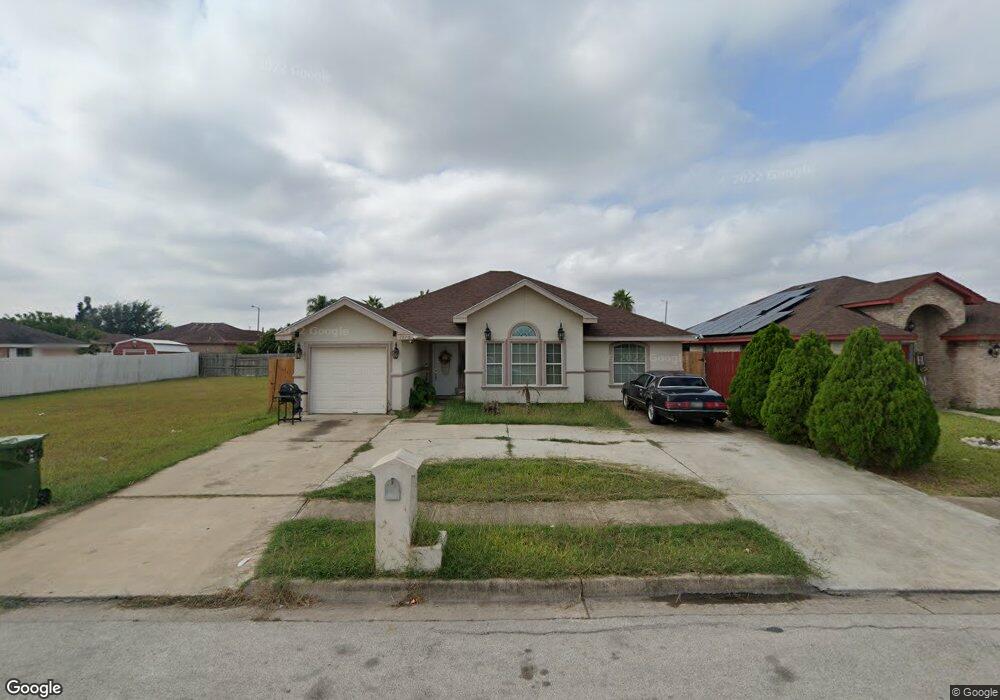
2876 Capri St Unit 5 Brownsville, TX 78520
Northwest Brownsville NeighborhoodEstimated Value: $163,000 - $203,854
3
Beds
2
Baths
1,655
Sq Ft
$115/Sq Ft
Est. Value
About This Home
This home is located at 2876 Capri St Unit 5, Brownsville, TX 78520 and is currently estimated at $190,714, approximately $115 per square foot. 2876 Capri St Unit 5 is a home located in Cameron County with nearby schools including Thomas W. Keller Elementary School, Edward Manzano Jr. Middle School, and Pace Early College High School.
Ownership History
Date
Name
Owned For
Owner Type
Purchase Details
Closed on
Jun 26, 2006
Sold by
Ramirez Victor T
Bought by
Macias Miguel Angel
Current Estimated Value
Home Financials for this Owner
Home Financials are based on the most recent Mortgage that was taken out on this home.
Original Mortgage
$93,650
Outstanding Balance
$65,704
Interest Rate
10.24%
Mortgage Type
Purchase Money Mortgage
Estimated Equity
$125,010
Purchase Details
Closed on
Jun 29, 2004
Sold by
South Padre Island Development Lp
Bought by
Laguna Star Builders Inc
Purchase Details
Closed on
Jun 21, 2002
Sold by
El Valle Properties Ltd
Bought by
Garza Maria Carlota
Home Financials for this Owner
Home Financials are based on the most recent Mortgage that was taken out on this home.
Original Mortgage
$14,000
Interest Rate
12%
Mortgage Type
Seller Take Back
Create a Home Valuation Report for This Property
The Home Valuation Report is an in-depth analysis detailing your home's value as well as a comparison with similar homes in the area
Home Values in the Area
Average Home Value in this Area
Purchase History
| Date | Buyer | Sale Price | Title Company |
|---|---|---|---|
| Macias Miguel Angel | -- | None Available | |
| Laguna Star Builders Inc | -- | Southern Texas Title Co | |
| Garza Maria Carlota | -- | -- |
Source: Public Records
Mortgage History
| Date | Status | Borrower | Loan Amount |
|---|---|---|---|
| Open | Macias Miguel Angel | $93,650 | |
| Previous Owner | Garza Maria Carlota | $14,000 |
Source: Public Records
Tax History Compared to Growth
Tax History
| Year | Tax Paid | Tax Assessment Tax Assessment Total Assessment is a certain percentage of the fair market value that is determined by local assessors to be the total taxable value of land and additions on the property. | Land | Improvement |
|---|---|---|---|---|
| 2025 | $4,144 | $180,457 | $43,000 | $137,457 |
| 2024 | $4,144 | $182,051 | $43,000 | $139,051 |
| 2023 | $3,961 | $172,644 | $32,000 | $140,644 |
| 2022 | $3,376 | $130,152 | $24,000 | $106,152 |
| 2021 | $3,395 | $131,314 | $24,000 | $107,314 |
| 2020 | $2,801 | $107,547 | $24,000 | $83,547 |
| 2019 | $2,888 | $108,454 | $24,000 | $84,454 |
| 2018 | $2,733 | $102,894 | $21,000 | $81,894 |
| 2017 | $2,215 | $87,369 | $21,000 | $66,369 |
| 2016 | $2,144 | $84,581 | $17,500 | $67,081 |
| 2015 | $2,126 | $84,794 | $17,000 | $67,794 |
Source: Public Records
Map
Nearby Homes
- 2782 Normandy St
- 0 W Alton Gloor Blvd
- 2848 Riviera St
- 3770 Altamira
- 1920 Royal Oak St
- 2822 W Alton Gloor Blvd
- 3564 Oviedo Dr
- 4025 Sevilla St
- 3949 Galicia Ct Unit 17
- 1809 Royal Oak St
- 1974 Royal Oak St
- 3516 Hidalgo Cir Unit LOT 1 BLK 4
- 3604 Hidalgo Cir Unit LOT 1 BLK 6
- 4071 Orense Dr
- 2655 Laredo Rd
- 2445 Las Brisas Blvd
- 1272 Costa Del Sol
- 3837 Ridge Trail
- 2400 Firenze St
- 1208 Costa Del Sol
- 2876 Capri St
- 2872 Capri St
- 2739 Normandy St
- 2884 Capri St
- 2868 Capri St
- 2743 Normandy St
- 2735 Normandy St
- 2731 Normandy St
- 2747 Normandy St
- 2864 Capri St
- 2888 Capri St
- 2881 Capri St
- 2727 Normandy St
- 2885 Capri St
- 2869 Capri St
- 2892 Capri St
- 2860 Capri St
- 2889 Capri St
- 2865 Capri St
- 2755 Normandy St