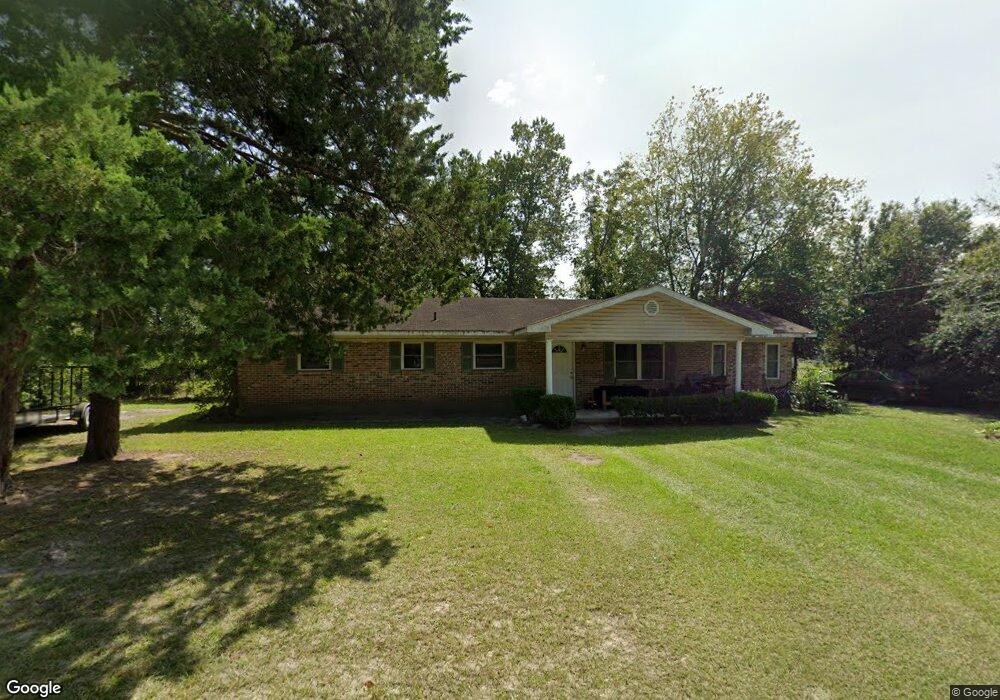
2877 Edgewood Rd Waycross, GA 31503
Estimated Value: $136,000 - $185,000
4
Beds
3
Baths
1,423
Sq Ft
$115/Sq Ft
Est. Value
About This Home
This home is located at 2877 Edgewood Rd, Waycross, GA 31503 and is currently estimated at $163,155, approximately $114 per square foot. 2877 Edgewood Rd is a home located in Ware County with nearby schools including Waresboro Elementary School, Ware County Middle School, and Ware County High School.
Ownership History
Date
Name
Owned For
Owner Type
Purchase Details
Closed on
Apr 7, 2014
Sold by
Bank Of America
Bought by
Davis Harry C
Current Estimated Value
Home Financials for this Owner
Home Financials are based on the most recent Mortgage that was taken out on this home.
Original Mortgage
$10,000,000
Outstanding Balance
$7,610,453
Interest Rate
4.37%
Mortgage Type
New Conventional
Estimated Equity
-$7,447,298
Purchase Details
Closed on
Jan 7, 2014
Sold by
Buchannan James Russell
Bought by
Bank Of America
Purchase Details
Closed on
Mar 6, 2007
Sold by
Buchannan James Russell
Bought by
Buchannan James Russell and Buchannan Chasity Lynn
Purchase Details
Closed on
Oct 26, 2004
Sold by
Manning James S
Bought by
Buchannan James R
Purchase Details
Closed on
Feb 13, 2002
Sold by
Manning James S
Bought by
Manning James S
Purchase Details
Closed on
Apr 22, 1997
Sold by
Manning Jewell
Bought by
Manning James S
Purchase Details
Closed on
Aug 30, 1985
Create a Home Valuation Report for This Property
The Home Valuation Report is an in-depth analysis detailing your home's value as well as a comparison with similar homes in the area
Home Values in the Area
Average Home Value in this Area
Purchase History
| Date | Buyer | Sale Price | Title Company |
|---|---|---|---|
| Davis Harry C | $54,600 | -- | |
| Bank Of America | $41,777 | -- | |
| Buchannan James Russell | -- | -- | |
| Buchannan James R | $54,000 | -- | |
| Manning James S | -- | -- | |
| Manning James S | -- | -- | |
| -- | $38,500 | -- |
Source: Public Records
Mortgage History
| Date | Status | Borrower | Loan Amount |
|---|---|---|---|
| Open | Davis Harry C | $10,000,000 |
Source: Public Records
Tax History Compared to Growth
Tax History
| Year | Tax Paid | Tax Assessment Tax Assessment Total Assessment is a certain percentage of the fair market value that is determined by local assessors to be the total taxable value of land and additions on the property. | Land | Improvement |
|---|---|---|---|---|
| 2024 | $1,563 | $64,640 | $8,820 | $55,820 |
| 2023 | $1,664 | $40,780 | $2,724 | $38,056 |
| 2022 | $1,177 | $40,780 | $2,724 | $38,056 |
| 2021 | $1,057 | $33,712 | $2,724 | $30,988 |
| 2020 | $867 | $27,332 | $2,724 | $24,608 |
| 2019 | $854 | $26,420 | $2,724 | $23,696 |
| 2018 | $737 | $22,580 | $2,724 | $19,856 |
| 2017 | $736 | $22,580 | $2,724 | $19,856 |
| 2016 | $736 | $22,580 | $2,724 | $19,856 |
| 2015 | $719 | $22,579 | $2,724 | $19,856 |
| 2014 | $822 | $25,019 | $2,724 | $22,295 |
| 2013 | -- | $25,019 | $2,724 | $22,295 |
Source: Public Records
Map
Nearby Homes
- 2836 Evergreen Rd
- 2857 Cherokee St
- 2867 Evergreen Rd
- 2885 Longwood Rd
- 850 Woodard Ln
- 1238 Red Keen Rd
- 1261 Lake St
- 2117 Tamara Rd
- 1210 N Augusta Ave
- Lot 155 N Augusta Avenue Cherokee Ave
- 2066 Cherokee St
- 1300 Stanton Ave
- 2180 Fulford Rd Unit n/a
- 0 Anita South St
- 2869 Ben St
- 2879 Ben St
- 2885 Ben St
- 221 Sierra Ln
- 274 S Anita St
- 1953 State St
- 23 Edgewood Rd
- 2867 Edgewood Rd
- 2887 Edgewood Rd
- 2886 Edgewood Rd
- 2882 Edgewood Rd
- 2895 Edgewood Rd
- 2847 Edgewood Rd
- 2890 Edgewood Rd
- 1449 Highland Rd
- 2872 Edgewood Rd
- 2878 Evergreen Rd
- 2868 Evergreen Rd
- 2839 Edgewood Rd
- 1540 Highland Rd
- 2852 Edgewood Rd
- 2867 Cherokee St
- 1410 Highland Rd
- 2883 Cherokee St
- 2848 Evergreen Rd
- 2893 Cherokee St