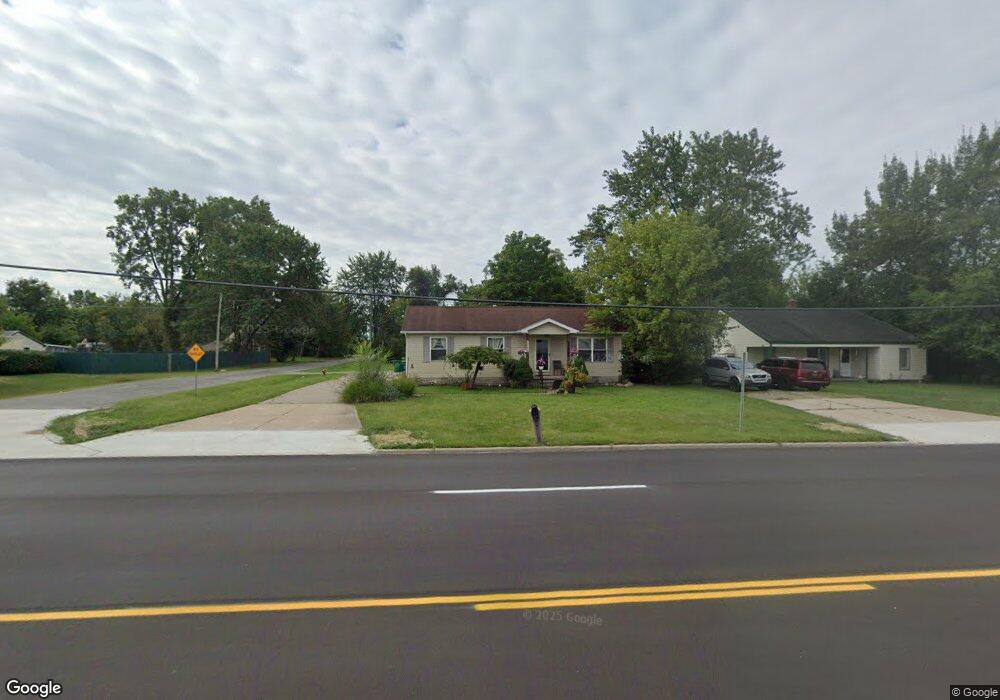
28775 Northline Rd Romulus, MI 48174
Estimated Value: $156,000 - $214,000
3
Beds
2
Baths
1,164
Sq Ft
$167/Sq Ft
Est. Value
About This Home
This home is located at 28775 Northline Rd, Romulus, MI 48174 and is currently estimated at $194,202, approximately $166 per square foot. 28775 Northline Rd is a home located in Wayne County with nearby schools including Halecreek Elementary School, Romulus Middle School, and Romulus Senior High School.
Ownership History
Date
Name
Owned For
Owner Type
Purchase Details
Closed on
Oct 15, 2021
Sold by
Ross Cheryl and Estate Of Ruth Bowles
Bought by
Estate Of Willard Bowles
Current Estimated Value
Purchase Details
Closed on
Jun 28, 2007
Sold by
Jpmorgan Chase Bank Na
Bought by
Homesales Inc
Purchase Details
Closed on
Jun 20, 2007
Sold by
Ezell Winford L and Ezell Sharon L
Bought by
Jpmorgan Chase Bank Na
Purchase Details
Closed on
Dec 8, 2003
Sold by
Fannie Mae
Bought by
Ezell Winford L and Ezell Sharon L
Purchase Details
Closed on
Jan 22, 2003
Sold by
Thornsberry Cynthia M
Bought by
Mortgage Electronic Registration Sy
Purchase Details
Closed on
Jan 6, 2003
Sold by
Mortgage Electronic Registration Systems
Bought by
Federal National Mortgage Association
Purchase Details
Closed on
Mar 14, 2001
Sold by
Thornsberry Donald
Bought by
Thornsberry Donnie A
Create a Home Valuation Report for This Property
The Home Valuation Report is an in-depth analysis detailing your home's value as well as a comparison with similar homes in the area
Home Values in the Area
Average Home Value in this Area
Purchase History
| Date | Buyer | Sale Price | Title Company |
|---|---|---|---|
| Estate Of Willard Bowles | -- | None Available | |
| Homesales Inc | -- | E Title Agency | |
| Jpmorgan Chase Bank Na | $90,624 | None Available | |
| Ezell Winford L | $109,900 | Greco | |
| Mortgage Electronic Registration Sy | $72,547 | -- | |
| Federal National Mortgage Association | -- | -- | |
| Thornsberry Donnie A | $85,000 | -- |
Source: Public Records
Tax History
| Year | Tax Paid | Tax Assessment Tax Assessment Total Assessment is a certain percentage of the fair market value that is determined by local assessors to be the total taxable value of land and additions on the property. | Land | Improvement |
|---|---|---|---|---|
| 2025 | $2,546 | $96,100 | $0 | $0 |
| 2024 | $2,526 | $87,800 | $0 | $0 |
| 2023 | $2,416 | $84,200 | $0 | $0 |
| 2022 | $2,685 | $80,800 | $0 | $0 |
| 2021 | $2,610 | $67,900 | $0 | $0 |
| 2020 | $2,557 | $47,500 | $0 | $0 |
| 2019 | $2,520 | $45,600 | $0 | $0 |
| 2018 | $1,825 | $41,500 | $0 | $0 |
| 2017 | $869 | $41,100 | $0 | $0 |
| 2016 | $2,124 | $40,800 | $0 | $0 |
| 2015 | $3,150 | $37,500 | $0 | $0 |
| 2013 | $4,440 | $48,500 | $0 | $0 |
| 2012 | $1,671 | $46,700 | $4,700 | $42,000 |
Source: Public Records
Map
Nearby Homes
- 11398 Harrison
- 20820 Inkster Rd
- 12000 Inkster Rd
- 00 Eureka Rd
- 14611 New York St
- 28109 Goddard Rd
- 15350 Woodmont St
- 00000 Northline Rd
- Lot 106 Hollywood
- Lot 107 Hollywood
- 00000 Huron
- 0 Hannan-Huro River Dr Unit 20261004710
- 16295 Vining Rd
- 0 Telegraph Rd Unit 20221042429
- Lot 105 Hollywood
- 15527 Meadow St
- 15654 Isabelle St
- 29934 Spain St
- 15721 Harrison St
- 15143 Siebert St
- 28795 Northline Rd
- 28721 Northline Rd
- 13060 Homefield St
- 28713 Northline Rd
- 13071 Homefield St
- 13080 Homefield St
- 28705 Northline Rd
- 13100 Homefield St
- 13100 Homefield St
- 28750 Northline Rd
- 29037 Northline Rd
- 13093 Homefield St
- 13125 Homefield St
- 29075 Northline Rd
- 29050 Northline Rd
- 13160 Homefield St
- 13159 Homefield St
- 29100 Northline Rd
- 29130 Northline Rd
- 29130 Northline Rd
Your Personal Tour Guide
Ask me questions while you tour the home.