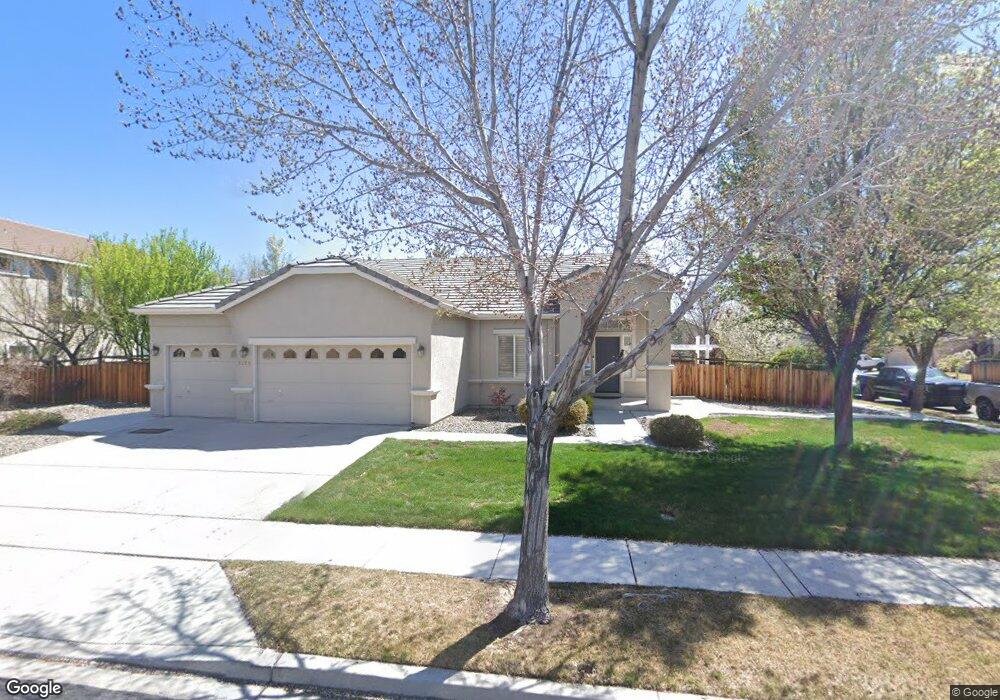
2878 Silverton Way Sparks, NV 89436
Wingfield Springs NeighborhoodEstimated Value: $591,632 - $647,000
3
Beds
2
Baths
1,981
Sq Ft
$314/Sq Ft
Est. Value
About This Home
This home is located at 2878 Silverton Way, Sparks, NV 89436 and is currently estimated at $622,908, approximately $314 per square foot. 2878 Silverton Way is a home located in Washoe County with nearby schools including Van Gorder Elementary School, Sky Ranch Middle School, and Spanish Springs High School.
Ownership History
Date
Name
Owned For
Owner Type
Purchase Details
Closed on
May 25, 2005
Sold by
Saguindel Dennis Sib and Saguindel Annie M
Bought by
Saguindel Dennis S and Saguindel Annie M
Current Estimated Value
Purchase Details
Closed on
Feb 4, 2004
Sold by
Saguindel Dennis Sib and Saguindel Annie M
Bought by
Saguindel Dennis Sib and Saguindel Annie M
Purchase Details
Closed on
Jul 14, 2003
Sold by
Silverado 140 Lp
Bought by
Saguindel Dennis S and Saguindel Annie M
Home Financials for this Owner
Home Financials are based on the most recent Mortgage that was taken out on this home.
Original Mortgage
$208,500
Outstanding Balance
$86,383
Interest Rate
5.15%
Mortgage Type
Unknown
Estimated Equity
$536,525
Create a Home Valuation Report for This Property
The Home Valuation Report is an in-depth analysis detailing your home's value as well as a comparison with similar homes in the area
Home Values in the Area
Average Home Value in this Area
Purchase History
| Date | Buyer | Sale Price | Title Company |
|---|---|---|---|
| Saguindel Dennis S | -- | First American | |
| Saguindel Dennis Sib | -- | First American | |
| Saguindel Dennis Sib | -- | -- | |
| Saguindel Dennis S | $264,560 | First American Title |
Source: Public Records
Mortgage History
| Date | Status | Borrower | Loan Amount |
|---|---|---|---|
| Open | Saguindel Dennis S | $208,500 |
Source: Public Records
Tax History Compared to Growth
Tax History
| Year | Tax Paid | Tax Assessment Tax Assessment Total Assessment is a certain percentage of the fair market value that is determined by local assessors to be the total taxable value of land and additions on the property. | Land | Improvement |
|---|---|---|---|---|
| 2026 | $2,646 | $158,918 | $46,375 | $112,543 |
| 2025 | $3,439 | $160,666 | $46,375 | $114,291 |
| 2024 | $3,340 | $153,866 | $38,290 | $115,576 |
| 2023 | $3,340 | $147,466 | $38,850 | $108,616 |
| 2022 | $3,243 | $122,443 | $32,060 | $90,383 |
| 2021 | $3,149 | $118,273 | $28,350 | $89,923 |
| 2020 | $3,056 | $119,543 | $29,470 | $90,073 |
| 2019 | $2,967 | $114,552 | $27,615 | $86,937 |
| 2018 | $2,878 | $104,938 | $19,845 | $85,093 |
| 2017 | $2,797 | $103,984 | $18,655 | $85,329 |
| 2016 | $2,726 | $104,455 | $17,675 | $86,780 |
| 2015 | $2,721 | $93,071 | $15,400 | $77,671 |
| 2014 | $2,642 | $81,752 | $13,195 | $68,557 |
| 2013 | -- | $61,505 | $10,710 | $50,795 |
Source: Public Records
Map
Nearby Homes
- 6638 Aston Cir Unit 18
- 2661 Lawry Dr
- 6658 Abbotswood Dr
- 6357 Peppergrass Dr
- 6767 Russian Thistle Dr
- 6375 N Ginger Quill Ct
- 2069 Marcus Way Unit Homesite 1
- 2073 Marcus Way Unit Homesite 2
- 2045 Elk Falls Way Unit Homesite 26
- 2041 Elk Falls Way Unit Homesite 25
- 2064 Marcus Way Unit Homesite 11
- 6036 Cielo Cir
- 2037 Elk Falls Way Unit Homesite 24
- 2037 Elk Falls Way
- 2025 Elk Falls Way
- 2230 Long Island Ct
- 6302 Cokenee Ct
- 2691 Sutter Butte Ct
- 6641 Peppergrass Dr
- 7090 Lemur Landing Way
- 2660 Dansant Ct
- 2888 Silverton Way
- 2848 Silverton Way Unit 17D
- 2871 Silverton Way Unit 17D
- 2881 Silverton Way Unit 17D
- 2670 Dansant Ct Unit 17D
- 2859 Silverton Way
- 2891 Silverton Way
- 2661 Dansant Ct
- 2838 Silverton Way
- 2680 Dansant Ct
- 2849 Silverton Way Unit 17D
- 2671 Dansant Ct
- 2681 Dansant Ct
- 2938 Silverton Way
- 2828 Silverton Way
- 2841 Silverton Way Unit 17D
- 2937 Silverton Way Unit 17C
- 2946 Silverton Way
- 2835 Silverton Way