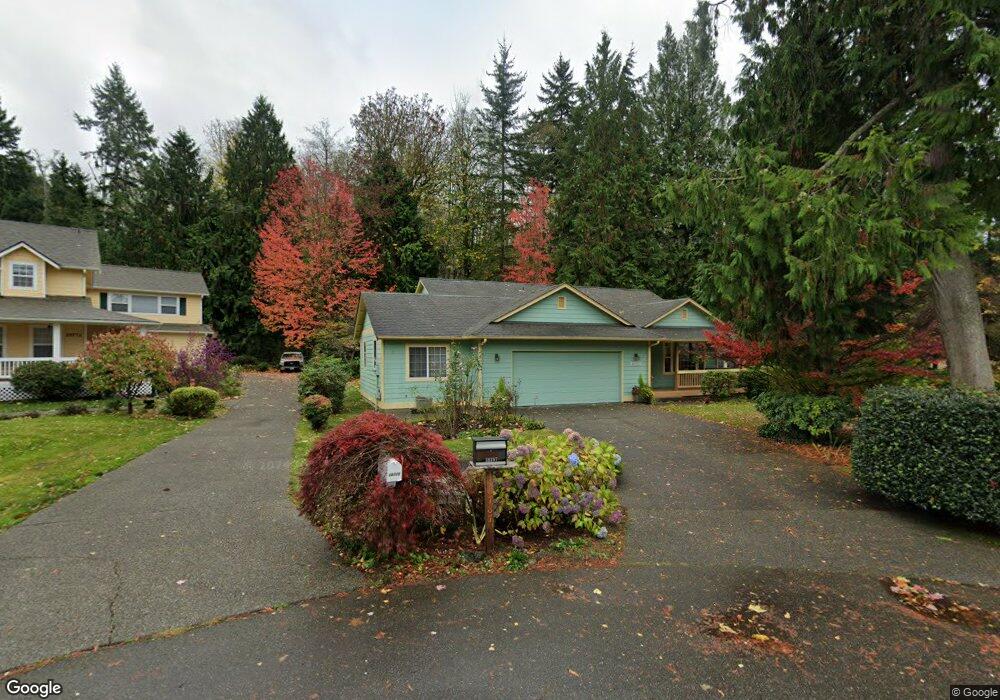
28787 Gresham Place NE Poulsbo, WA 98370
Lofall NeighborhoodEstimated Value: $747,786 - $841,000
3
Beds
2
Baths
2,010
Sq Ft
$386/Sq Ft
Est. Value
About This Home
This home is located at 28787 Gresham Place NE, Poulsbo, WA 98370 and is currently estimated at $774,947, approximately $385 per square foot. 28787 Gresham Place NE is a home located in Kitsap County with nearby schools including Vinland Elementary School, Poulsbo Middle School, and North Kitsap High School.
Ownership History
Date
Name
Owned For
Owner Type
Purchase Details
Closed on
Jul 29, 2008
Sold by
Kehrli Wiley A and Kehrli Nancy B
Bought by
Guthrie Jimi
Current Estimated Value
Home Financials for this Owner
Home Financials are based on the most recent Mortgage that was taken out on this home.
Original Mortgage
$278,400
Interest Rate
6.41%
Mortgage Type
Purchase Money Mortgage
Purchase Details
Closed on
Nov 18, 1998
Sold by
Ice Cream Factory Inc
Bought by
Kehrli Wiley A and Kehrli Nancy B
Home Financials for this Owner
Home Financials are based on the most recent Mortgage that was taken out on this home.
Original Mortgage
$100,000
Interest Rate
6.42%
Purchase Details
Closed on
Jul 29, 1998
Sold by
Gresham Craig A and Gresham Margaret E
Bought by
Ice Cream Factory Inc and Karl Prisk Construction
Home Financials for this Owner
Home Financials are based on the most recent Mortgage that was taken out on this home.
Original Mortgage
$148,000
Interest Rate
6.95%
Mortgage Type
Construction
Create a Home Valuation Report for This Property
The Home Valuation Report is an in-depth analysis detailing your home's value as well as a comparison with similar homes in the area
Home Values in the Area
Average Home Value in this Area
Purchase History
| Date | Buyer | Sale Price | Title Company |
|---|---|---|---|
| Guthrie Jimi | $348,280 | Transnation Title Ins Co | |
| Kehrli Wiley A | $184,500 | Transnation Title Ins Co | |
| Ice Cream Factory Inc | $41,400 | Transnation Title Insurance |
Source: Public Records
Mortgage History
| Date | Status | Borrower | Loan Amount |
|---|---|---|---|
| Closed | Guthrie Jimi | $278,400 | |
| Previous Owner | Kehrli Wiley A | $100,000 | |
| Previous Owner | Ice Cream Factory Inc | $148,000 |
Source: Public Records
Tax History Compared to Growth
Tax History
| Year | Tax Paid | Tax Assessment Tax Assessment Total Assessment is a certain percentage of the fair market value that is determined by local assessors to be the total taxable value of land and additions on the property. | Land | Improvement |
|---|---|---|---|---|
| 2026 | $5,543 | $623,480 | $115,190 | $508,290 |
| 2025 | $5,543 | $623,480 | $115,190 | $508,290 |
| 2024 | $5,459 | $634,600 | $99,820 | $534,780 |
| 2023 | $5,547 | $634,600 | $99,820 | $534,780 |
| 2022 | $4,781 | $518,310 | $82,970 | $435,340 |
| 2021 | $4,540 | $454,900 | $72,600 | $382,300 |
| 2020 | $4,397 | $433,980 | $69,360 | $364,620 |
| 2019 | $4,140 | $407,340 | $64,820 | $342,520 |
| 2018 | $4,292 | $354,670 | $64,820 | $289,850 |
| 2017 | $4,035 | $354,670 | $64,820 | $289,850 |
| 2016 | $3,973 | $321,440 | $64,820 | $256,620 |
| 2015 | $3,680 | $299,280 | $64,820 | $234,460 |
| 2014 | -- | $286,360 | $64,820 | $221,540 |
| 2013 | -- | $286,360 | $64,820 | $221,540 |
Source: Public Records
Map
Nearby Homes
- 28393 State Hwy 3 NE
- 28389 State Highway 3 NE
- 2 XXX NW Park St
- 29191 Scenic Dr NE
- 27272 Big Valley Rd NE
- 27405 Lofall Ct NW
- 29722 State Highway 3 NE
- 0 XXX Sanderling Place NE
- 26654 NW Lofall Rd
- 0 State Hwy 3 NE Unit NWM2410405
- 1799 NW Mulholland Blvd
- 26495 NW Edgewater Blvd
- 1918 NW Russell St
- 1841 NW Russell St
- 23490 Marinwood Cir NE Unit 1212
- 1881 NW Seclusion Cove Way
- 25749 Pyramid Ln NW
- 999 Maxview Dr
- 42 Maxview Dr
- 365 Seattle Dr
- 28775 Gresham Place NE
- 28763 Gresham Place NE
- 28788 Gresham Place NE
- 28764 Gresham Place NE
- 28812 Gresham Place NE
- 28776 Gresham Place NE
- 418 NE Oyster Point Dr
- 28920 Beach Dr NE
- 473 NE Oyster Point Dr
- 436 NE Oyster Point Dr
- 28944 Beach Dr NE
- 472 NE Oyster Point Dr
- 454 NE Oyster Point Dr
- 491 NE Oyster Point Dr
- 28915 Beach Dr NE
- 28972 Beach Dr NE
- 328 NE Oyster Point Dr
- 529 Surfcrest Place NE
- 509 NE Oyster Point Dr