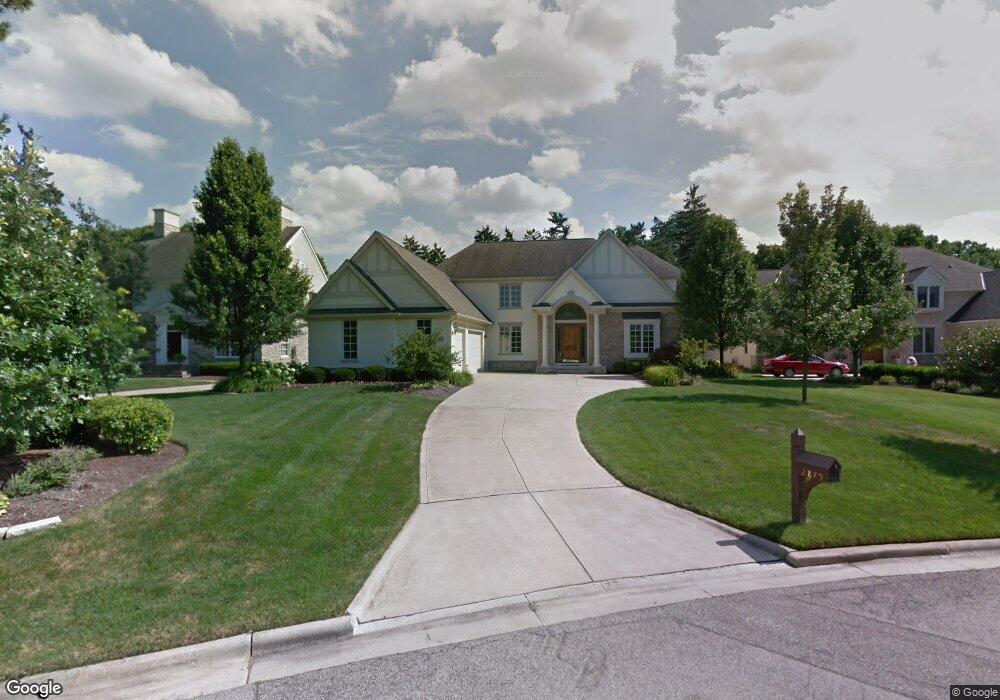
2879 Wickliffe Rd Upper Arlington, OH 43221
Estimated Value: $1,437,000 - $1,610,000
4
Beds
5
Baths
4,054
Sq Ft
$380/Sq Ft
Est. Value
About This Home
This home is located at 2879 Wickliffe Rd, Upper Arlington, OH 43221 and is currently estimated at $1,541,781, approximately $380 per square foot. 2879 Wickliffe Rd is a home located in Franklin County with nearby schools including Tremont Elementary School, Jones Middle School, and Upper Arlington High School.
Ownership History
Date
Name
Owned For
Owner Type
Purchase Details
Closed on
Apr 29, 2022
Sold by
Connie J Waite Trust
Bought by
Cooley Nathan D and Cooley Bethany D
Current Estimated Value
Home Financials for this Owner
Home Financials are based on the most recent Mortgage that was taken out on this home.
Original Mortgage
$1,237,500
Outstanding Balance
$1,150,616
Interest Rate
3.5%
Mortgage Type
New Conventional
Estimated Equity
$391,165
Purchase Details
Closed on
Jun 6, 2013
Sold by
Waite Connie J
Bought by
Waite Connie J and The Connie J Waite Trust
Purchase Details
Closed on
May 17, 2002
Sold by
Bittoni Homes Inc
Bought by
Waite Connie J
Home Financials for this Owner
Home Financials are based on the most recent Mortgage that was taken out on this home.
Original Mortgage
$650,000
Interest Rate
7%
Mortgage Type
Purchase Money Mortgage
Purchase Details
Closed on
Jan 4, 2001
Sold by
Walker Richard L
Bought by
Bittoni Homes Inc
Purchase Details
Closed on
Feb 24, 1989
Bought by
Schwartz Vicki B
Create a Home Valuation Report for This Property
The Home Valuation Report is an in-depth analysis detailing your home's value as well as a comparison with similar homes in the area
Home Values in the Area
Average Home Value in this Area
Purchase History
| Date | Buyer | Sale Price | Title Company |
|---|---|---|---|
| Cooley Nathan D | $1,375,000 | New Title Company Name | |
| Waite Connie J | -- | None Available | |
| Waite Connie J | $904,000 | -- | |
| Bittoni Homes Inc | -- | -- | |
| Walker Richard L | -- | -- | |
| Bittoni Homes Inc | -- | -- | |
| Walker Richard L | -- | -- | |
| Schwartz Vicki B | -- | -- |
Source: Public Records
Mortgage History
| Date | Status | Borrower | Loan Amount |
|---|---|---|---|
| Open | Cooley Nathan D | $1,237,500 | |
| Previous Owner | Waite Connie J | $650,000 |
Source: Public Records
Tax History Compared to Growth
Tax History
| Year | Tax Paid | Tax Assessment Tax Assessment Total Assessment is a certain percentage of the fair market value that is determined by local assessors to be the total taxable value of land and additions on the property. | Land | Improvement |
|---|---|---|---|---|
| 2024 | $25,391 | $438,590 | $88,100 | $350,490 |
| 2023 | $25,077 | $438,585 | $88,095 | $350,490 |
| 2022 | $26,906 | $382,900 | $54,670 | $328,230 |
| 2021 | $23,685 | $382,900 | $54,670 | $328,230 |
| 2020 | $23,475 | $382,900 | $54,670 | $328,230 |
| 2019 | $21,336 | $307,690 | $54,670 | $253,020 |
| 2018 | $19,021 | $307,690 | $54,670 | $253,020 |
| 2017 | $21,172 | $307,690 | $54,670 | $253,020 |
| 2016 | $16,840 | $254,700 | $73,540 | $181,160 |
| 2015 | $16,826 | $254,700 | $73,540 | $181,160 |
| 2014 | $16,845 | $254,700 | $73,540 | $181,160 |
| 2013 | $10,731 | $308,910 | $66,850 | $242,060 |
Source: Public Records
Map
Nearby Homes
- 3441 Sunset Dr
- 2714 Woodstock Rd
- 2745 Cranford Rd
- 3190 Kioka Ave
- 2666 Shrewsbury Rd
- 2731 Clifton Rd
- 2565 Nottingham Rd
- 2785 Chateau Cir Unit 69
- 3414 Loire Ln
- 3127 Griggsview Ct
- 2782 Chateau Cir S Unit 45
- 3163 S Dorchester Rd
- 3159 Griggsview Ct Unit 3159
- 3163 Griggsview Ct
- 3278 Brookview Way Unit 4
- 2443 Shrewsbury Rd
- 2424 Nottingham Rd
- 3216 Polley Rd
- 2401 Shrewsbury Rd
- 3241 Summertime Ct Unit 32
- 2879 Wickliffe Woods Ct
- 2889 Wickliffe Rd
- 2869 Wickliffe Rd
- 2889 Wickliffe Woods Ct
- 2869 Wickliffe Woods Ct
- 2865 Wickliffe Rd
- 3411 Wickliffe Rd
- 2901 Wickliffe Woods Ct
- 2878 Eastcleft Dr
- 2900 Wickliffe Woods Ct
- 2890 Eastcleft Dr
- 2866 Eastcleft Dr
- 2853 Wickliffe Rd
- 2858 Eastcleft Dr
- 2900 Eastcleft Dr
- 3405 Sunset Dr
- 3405 Sunset Dr
- 3366 Riverside Dr Unit 103
- 3366 Riverside Dr
- 2841 Wickliffe Rd