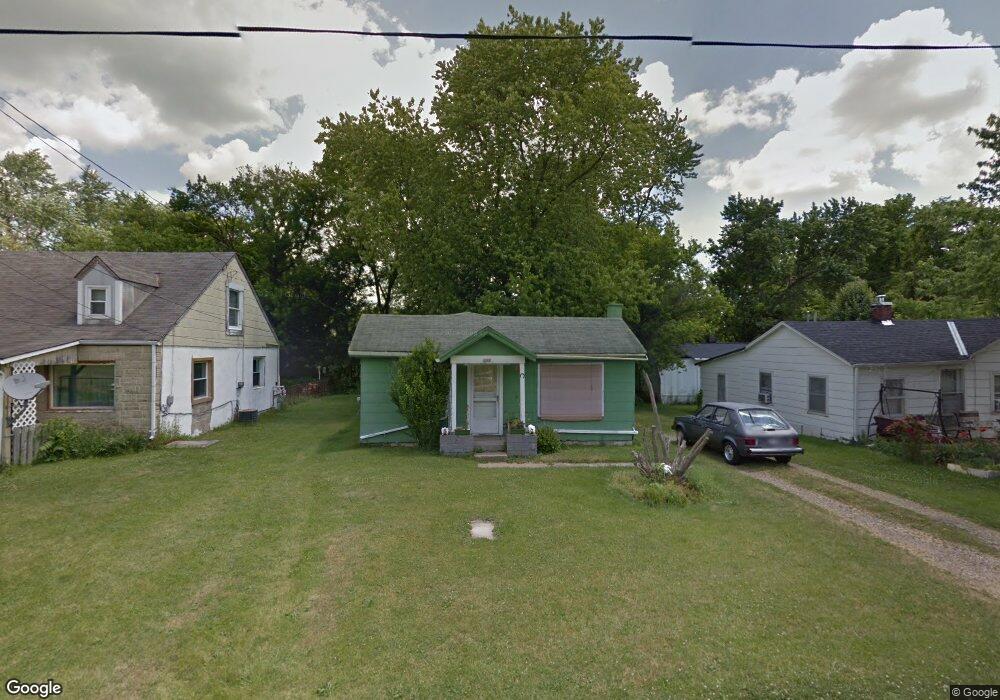
288 6th Ave Mansfield, OH 44905
Estimated Value: $64,237 - $89,000
2
Beds
1
Bath
704
Sq Ft
$102/Sq Ft
Est. Value
About This Home
This home is located at 288 6th Ave, Mansfield, OH 44905 and is currently estimated at $71,809, approximately $102 per square foot. 288 6th Ave is a home located in Richland County with nearby schools including Madison High School, Temple-Christian School, and St. Peter's Elementary/Montessori School.
Ownership History
Date
Name
Owned For
Owner Type
Purchase Details
Closed on
Feb 6, 2026
Sold by
Andrews Wendy
Bought by
K & S Property Management & Holdings Llc
Current Estimated Value
Purchase Details
Closed on
May 10, 2024
Sold by
Arbutina Maria Charlene
Bought by
Andrews Wendy
Purchase Details
Closed on
Aug 17, 2023
Sold by
Living Trust
Bought by
Arbutina Maria Charlene
Purchase Details
Closed on
Jun 17, 2015
Sold by
Arbutina Maria C and Arbutina Maria
Bought by
Arbutina Maria Charlene and The Living Trust Of Maria Char
Purchase Details
Closed on
Apr 3, 2015
Sold by
Leonhardt Theresa M
Bought by
Arbutina Maria
Create a Home Valuation Report for This Property
The Home Valuation Report is an in-depth analysis detailing your home's value as well as a comparison with similar homes in the area
Home Values in the Area
Average Home Value in this Area
Purchase History
| Date | Buyer | Sale Price | Title Company |
|---|---|---|---|
| K & S Property Management & Holdings Llc | $5,000 | None Listed On Document | |
| Andrews Wendy | $10,000 | Hawkins Title | |
| Andrews Wendy | $10,000 | Hawkins Title | |
| Arbutina Maria Charlene | -- | None Listed On Document | |
| Arbutina Maria Charlene | -- | Attorney | |
| Arbutina Maria | -- | Attorney |
Source: Public Records
Tax History
| Year | Tax Paid | Tax Assessment Tax Assessment Total Assessment is a certain percentage of the fair market value that is determined by local assessors to be the total taxable value of land and additions on the property. | Land | Improvement |
|---|---|---|---|---|
| 2024 | $677 | $3,160 | $2,240 | $920 |
| 2023 | $131 | $3,160 | $2,240 | $920 |
| 2022 | $142 | $3,170 | $2,330 | $840 |
| 2021 | $142 | $3,170 | $2,330 | $840 |
| 2020 | $144 | $3,170 | $2,330 | $840 |
| 2019 | $137 | $2,730 | $1,970 | $760 |
| 2018 | $136 | $2,730 | $1,970 | $760 |
| 2017 | $188 | $5,050 | $3,290 | $1,760 |
| 2016 | $304 | $6,080 | $3,190 | $2,890 |
| 2015 | $164 | $6,080 | $3,190 | $2,890 |
| 2014 | $297 | $6,080 | $3,190 | $2,890 |
| 2012 | -- | $6,270 | $3,290 | $2,980 |
Source: Public Records
Map
Nearby Homes
Your Personal Tour Guide
Ask me questions while you tour the home.