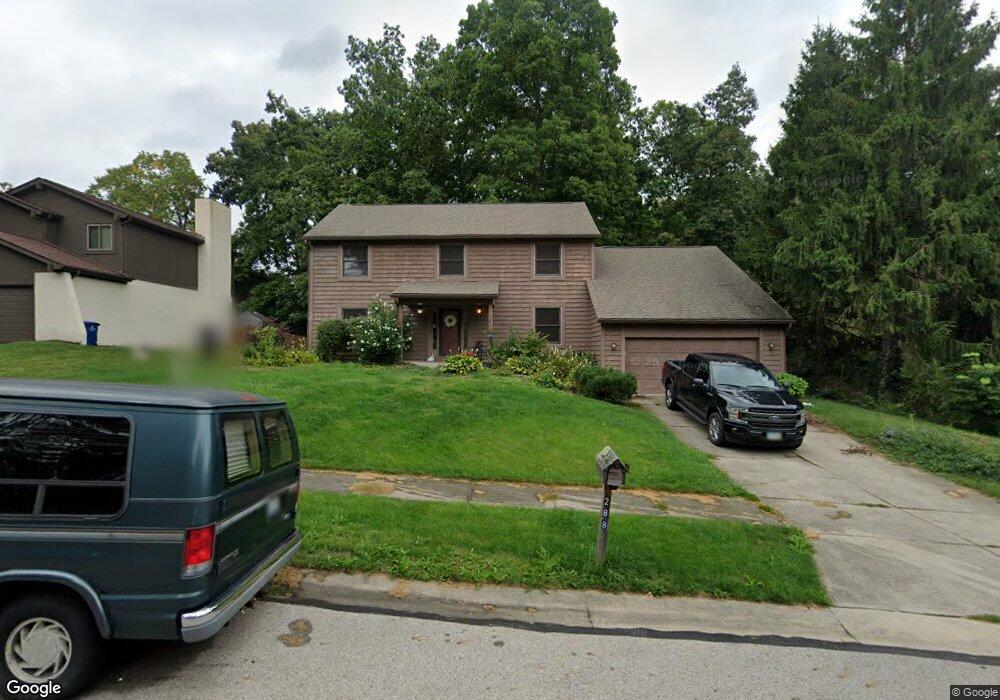
288 Bruce Ct Westerville, OH 43081
Estimated Value: $453,000 - $498,000
4
Beds
3
Baths
2,386
Sq Ft
$201/Sq Ft
Est. Value
About This Home
This home is located at 288 Bruce Ct, Westerville, OH 43081 and is currently estimated at $478,562, approximately $200 per square foot. 288 Bruce Ct is a home located in Franklin County with nearby schools including Annehurst Elementary School, Heritage Middle School, and Westerville South High School.
Ownership History
Date
Name
Owned For
Owner Type
Purchase Details
Closed on
Jan 23, 2017
Sold by
Brown Joel A
Bought by
Brown Joel A and Brown Susanne J
Current Estimated Value
Purchase Details
Closed on
Mar 30, 2009
Sold by
Blessing Darcy M
Bought by
Brown Joel A
Purchase Details
Closed on
May 2, 2006
Sold by
Zielinski John R and Zielinski Diane S
Bought by
Brown Joel A
Home Financials for this Owner
Home Financials are based on the most recent Mortgage that was taken out on this home.
Original Mortgage
$183,200
Interest Rate
6.25%
Mortgage Type
Fannie Mae Freddie Mac
Purchase Details
Closed on
Oct 4, 2005
Sold by
Yoder David E and Yoder Marcia L
Bought by
Zielinski John R and Zielinski Diane S
Home Financials for this Owner
Home Financials are based on the most recent Mortgage that was taken out on this home.
Original Mortgage
$199,200
Interest Rate
7.99%
Mortgage Type
Fannie Mae Freddie Mac
Purchase Details
Closed on
Jun 15, 1983
Bought by
Yoder David E and Yoder Marcia L
Create a Home Valuation Report for This Property
The Home Valuation Report is an in-depth analysis detailing your home's value as well as a comparison with similar homes in the area
Home Values in the Area
Average Home Value in this Area
Purchase History
| Date | Buyer | Sale Price | Title Company |
|---|---|---|---|
| Brown Joel A | -- | Great American Title | |
| Brown Joel A | -- | None Available | |
| Brown Joel A | $229,000 | Talon Group | |
| Zielinski John R | $249,000 | Polaris Tit | |
| Yoder David E | $20,000 | -- |
Source: Public Records
Mortgage History
| Date | Status | Borrower | Loan Amount |
|---|---|---|---|
| Previous Owner | Brown Joel A | $183,200 | |
| Previous Owner | Zielinski John R | $199,200 | |
| Closed | Brown Joel A | $0 |
Source: Public Records
Tax History Compared to Growth
Tax History
| Year | Tax Paid | Tax Assessment Tax Assessment Total Assessment is a certain percentage of the fair market value that is determined by local assessors to be the total taxable value of land and additions on the property. | Land | Improvement |
|---|---|---|---|---|
| 2024 | $7,824 | $137,660 | $33,250 | $104,410 |
| 2023 | $7,658 | $137,655 | $33,250 | $104,405 |
| 2022 | $6,439 | $88,380 | $19,990 | $68,390 |
| 2021 | $6,493 | $88,380 | $19,990 | $68,390 |
| 2020 | $6,475 | $88,380 | $19,990 | $68,390 |
| 2019 | $5,940 | $76,550 | $19,990 | $56,560 |
| 2018 | $6,314 | $76,550 | $19,990 | $56,560 |
| 2017 | $6,434 | $76,550 | $19,990 | $56,560 |
| 2016 | $7,026 | $83,800 | $17,330 | $66,470 |
| 2015 | $6,805 | $83,800 | $17,330 | $66,470 |
| 2014 | $6,810 | $83,800 | $17,330 | $66,470 |
| 2013 | $3,400 | $83,790 | $17,325 | $66,465 |
Source: Public Records
Map
Nearby Homes
- 828 Memories Ln
- 953 Arcadia Blvd
- 1024 Arcadia Blvd
- 640 Glacier Pass
- 658 River Trace
- 106 Ormsbee Ave
- 258 Bellefield Ave
- 774 W Main St
- 0 Olde Worthington Rd
- 1095 Belle Meade Place
- 8278 Mira St Unit 154
- 8282 Mira St Unit 153
- 101 W Ticonderoga Dr Unit B
- 321 Pinnate Ln Unit Lot 1504
- 327 Pinnate Ln Unit Lot 1502
- 331 Pinnate Ln Unit Lot 1501
- 322 Pinnate Ln Unit Lot 1201
- 324 Pinnate Ln Unit Lot 1202
- 328 Pinnate Ln Unit Lot 1203
- 332 Pinnate Ln Unit Lot 1204
- 282 Bruce Ct
- 296 Bruce Ct
- 893 Maebelle Way
- 304 Bruce Ct
- 297 Bruce Ct
- 281 Bruce Ct
- 883 Maebelle Way
- 305 Bruce Ct
- 931 Maebelle Way
- 875 Maebelle Way
- 898 Maebelle Way
- 906 Maebelle Way
- 890 Maebelle Way
- 914 Maebelle Way
- 311 Windcroft Dr
- 852 Memories Ln
- 922 Maebelle Way
- 860 Memories Ln
- 836 Memories Ln
- 283 Abbotsbury Dr