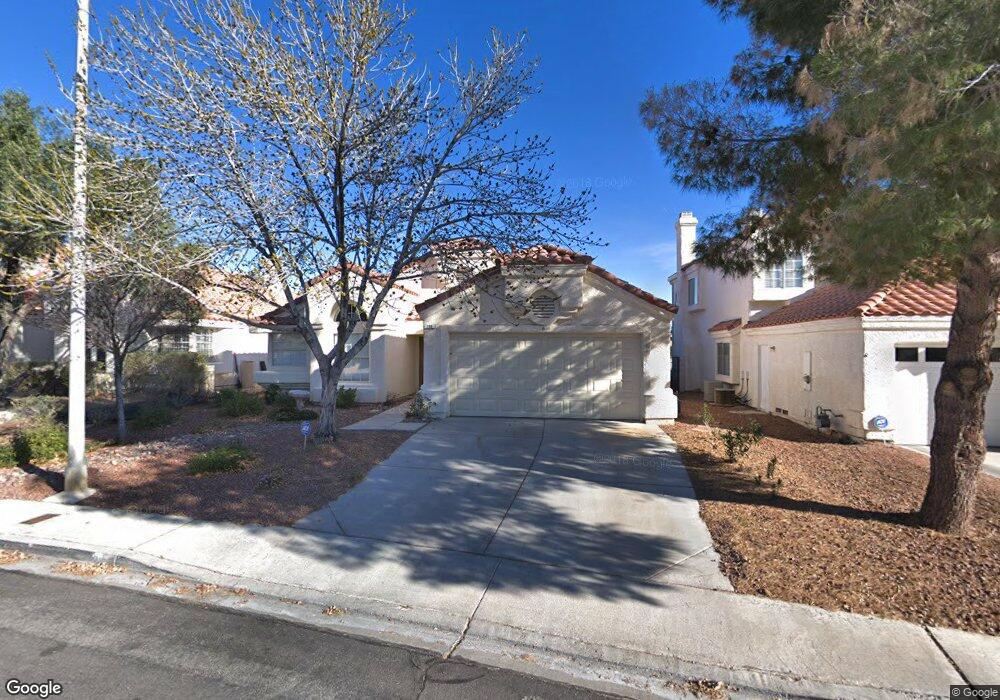
288 Cameron Hill Ct Unit 2 Henderson, NV 89074
Green Valley North NeighborhoodEstimated Value: $483,345 - $489,000
3
Beds
2
Baths
1,603
Sq Ft
$304/Sq Ft
Est. Value
About This Home
This home is located at 288 Cameron Hill Ct Unit 2, Henderson, NV 89074 and is currently estimated at $487,086, approximately $303 per square foot. 288 Cameron Hill Ct Unit 2 is a home located in Clark County with nearby schools including James Gibson Elementary School, Barbara and Hank Greenspun Junior High School, and Green Valley High School.
Ownership History
Date
Name
Owned For
Owner Type
Purchase Details
Closed on
Jul 26, 2011
Sold by
Udin Victor and Ioudina Marina
Bought by
Udin Victor A and Ioudina Marina
Current Estimated Value
Home Financials for this Owner
Home Financials are based on the most recent Mortgage that was taken out on this home.
Original Mortgage
$140,349
Outstanding Balance
$96,858
Interest Rate
4.5%
Mortgage Type
FHA
Estimated Equity
$390,228
Purchase Details
Closed on
Jul 21, 2011
Sold by
Estates Of Robert James & Marion Abend S
Bought by
Udin Victor and Ioudina Marina
Home Financials for this Owner
Home Financials are based on the most recent Mortgage that was taken out on this home.
Original Mortgage
$140,349
Outstanding Balance
$96,858
Interest Rate
4.5%
Mortgage Type
FHA
Estimated Equity
$390,228
Purchase Details
Closed on
Mar 15, 1995
Sold by
Sieber Robert J
Bought by
Sieber Robert J and Sieber Revocable Living Trust
Create a Home Valuation Report for This Property
The Home Valuation Report is an in-depth analysis detailing your home's value as well as a comparison with similar homes in the area
Home Values in the Area
Average Home Value in this Area
Purchase History
| Date | Buyer | Sale Price | Title Company |
|---|---|---|---|
| Udin Victor A | -- | Chicago Title Las Vegas | |
| Udin Victor | $144,000 | Chicago Title Las Vegas | |
| Sieber Robert J | -- | -- |
Source: Public Records
Mortgage History
| Date | Status | Borrower | Loan Amount |
|---|---|---|---|
| Open | Udin Victor A | $140,349 |
Source: Public Records
Tax History Compared to Growth
Tax History
| Year | Tax Paid | Tax Assessment Tax Assessment Total Assessment is a certain percentage of the fair market value that is determined by local assessors to be the total taxable value of land and additions on the property. | Land | Improvement |
|---|---|---|---|---|
| 2025 | $2,461 | $100,042 | $39,900 | $60,142 |
| 2024 | $2,280 | $100,042 | $39,900 | $60,142 |
| 2023 | $1,518 | $92,661 | $35,000 | $57,661 |
| 2022 | $2,111 | $84,015 | $30,660 | $53,355 |
| 2021 | $1,955 | $79,014 | $28,000 | $51,014 |
| 2020 | $1,812 | $78,249 | $27,300 | $50,949 |
| 2019 | $1,698 | $74,306 | $23,800 | $50,506 |
| 2018 | $1,621 | $69,409 | $20,300 | $49,109 |
| 2017 | $2,022 | $69,739 | $19,600 | $50,139 |
| 2016 | $1,518 | $63,516 | $12,950 | $50,566 |
| 2015 | $1,514 | $59,744 | $10,500 | $49,244 |
| 2014 | $1,470 | $49,226 | $10,325 | $38,901 |
Source: Public Records
Map
Nearby Homes
- 1939 Guinn Dr
- 272 Grand Teton Dr
- 316 Santa Monica Dr
- 2108 Running River Rd
- 1926 Navarre Ln
- 259 Spring Hills Ln
- 347 Gana Ct Unit B
- 372 Rushing Creek Ct
- 322 Oliveiro Ct
- 1832 Muchacha Dr
- 346 Pinnacle Ct
- 2150 Running River Rd
- 1831 Escondido Terrace
- 246 Windsong Dr
- 1809 Nuevo Rd
- 1810 Nuevo Rd
- 327 Fuente Dr
- 1952 Barranca Dr
- 371 Legacy Dr
- 271 Sunshine Springs Ct
- 290 Cameron Hill Ct
- 286 Cameron Hill Ct
- 292 Cameron Hill Ct
- 1938 Guinn Dr
- 1936 Guinn Dr
- 294 Cameron Hill Ct
- 287 Cameron Hill Ct
- 289 Cameron Hill Ct
- 291 Cameron Hill Ct
- 296 Cameron Hill Ct Unit 2
- 1934 Guinn Dr
- 293 Cameron Hill Ct
- 1937 Guinn Dr
- 295 Cameron Hill Ct
- 1932 Guinn Dr
- 290 Davis Hill Ct
- 298 Cameron Hill Ct
- 292 Davis Hill Ct Unit 2
- 1935 Guinn Dr
- 294 Davis Hill Ct