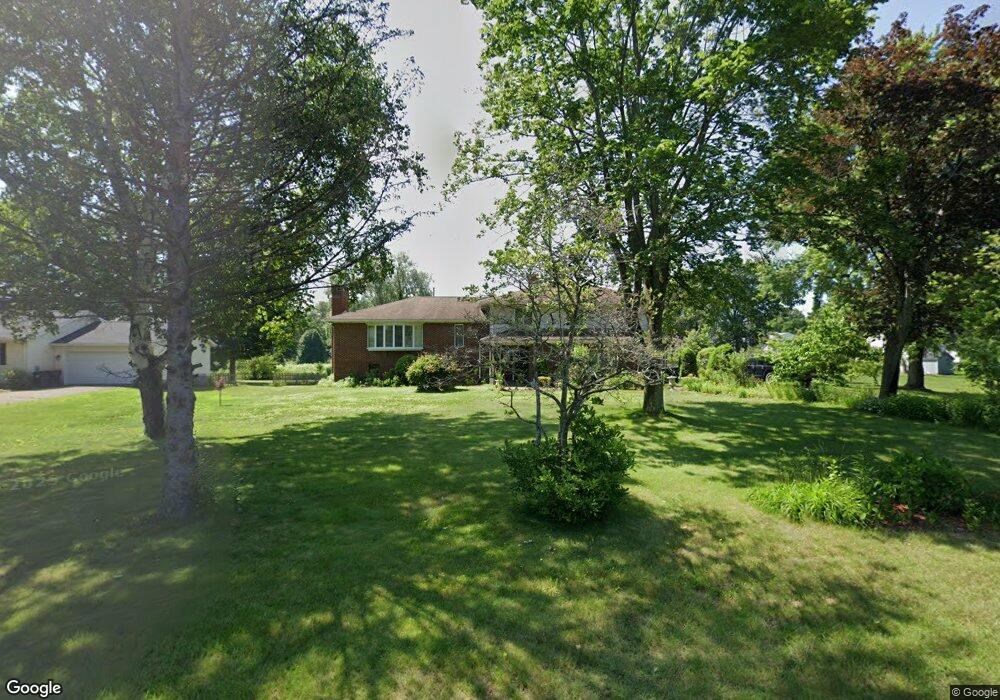
288 Corey St Agawam, MA 01001
Estimated Value: $520,000 - $606,000
3
Beds
2
Baths
2,590
Sq Ft
$213/Sq Ft
Est. Value
About This Home
This home is located at 288 Corey St, Agawam, MA 01001 and is currently estimated at $550,928, approximately $212 per square foot. 288 Corey St is a home located in Hampden County with nearby schools including Agawam Junior High School, Agawam High School, and Veritas Preparatory Charter School.
Ownership History
Date
Name
Owned For
Owner Type
Purchase Details
Closed on
Oct 8, 1981
Bought by
Scala Gerardo and Scala Theresa
Current Estimated Value
Create a Home Valuation Report for This Property
The Home Valuation Report is an in-depth analysis detailing your home's value as well as a comparison with similar homes in the area
Home Values in the Area
Average Home Value in this Area
Purchase History
| Date | Buyer | Sale Price | Title Company |
|---|---|---|---|
| Scala Gerardo | -- | -- |
Source: Public Records
Mortgage History
| Date | Status | Borrower | Loan Amount |
|---|---|---|---|
| Open | Scala Gerardo | $161,600 | |
| Closed | Scala Gerardo | $72,300 | |
| Closed | Scala Gerardo | $191,250 | |
| Closed | Scala Gerardo | $110,000 |
Source: Public Records
Tax History
| Year | Tax Paid | Tax Assessment Tax Assessment Total Assessment is a certain percentage of the fair market value that is determined by local assessors to be the total taxable value of land and additions on the property. | Land | Improvement |
|---|---|---|---|---|
| 2025 | $7,692 | $525,400 | $146,400 | $379,000 |
| 2024 | $7,562 | $520,100 | $146,400 | $373,700 |
| 2023 | $6,875 | $435,700 | $132,900 | $302,800 |
| 2022 | $6,499 | $403,400 | $132,900 | $270,500 |
| 2021 | $5,993 | $356,700 | $116,200 | $240,500 |
| 2020 | $6,284 | $373,400 | $114,000 | $259,400 |
| 2019 | $6,124 | $367,800 | $111,000 | $256,800 |
| 2018 | $5,855 | $352,500 | $109,800 | $242,700 |
| 2017 | $5,604 | $343,600 | $109,800 | $233,800 |
| 2016 | $5,394 | $333,400 | $109,800 | $223,600 |
| 2015 | $5,169 | $328,400 | $109,800 | $218,600 |
Source: Public Records
Map
Nearby Homes
- 192 Regency Park Dr
- 47 Corey Colonial
- 270 Regency Park Dr
- 271 Regency Park Dr Unit 271
- 204 Regency Park Dr
- 178 Beekman Dr
- 32 Lealand Ave
- 19 Greenwood St
- 47 Roberta Cir
- 52 Peros Dr
- 58 Englewood Rd
- 50 Elmwood Ave
- 283 Longhill St
- 34 Sumner Ave Unit 302
- 34 Sumner Ave Unit 314
- 34 Sumner Ave Unit 208
- 304-306 Cooper St
- 57 Reed St
- 226 Fort Pleasant Ave
- 4H Mapleviewlane Unit 4H
Your Personal Tour Guide
Ask me questions while you tour the home.