Estimated Value: $102,000 - $154,405
2
Beds
2
Baths
1,526
Sq Ft
$85/Sq Ft
Est. Value
About This Home
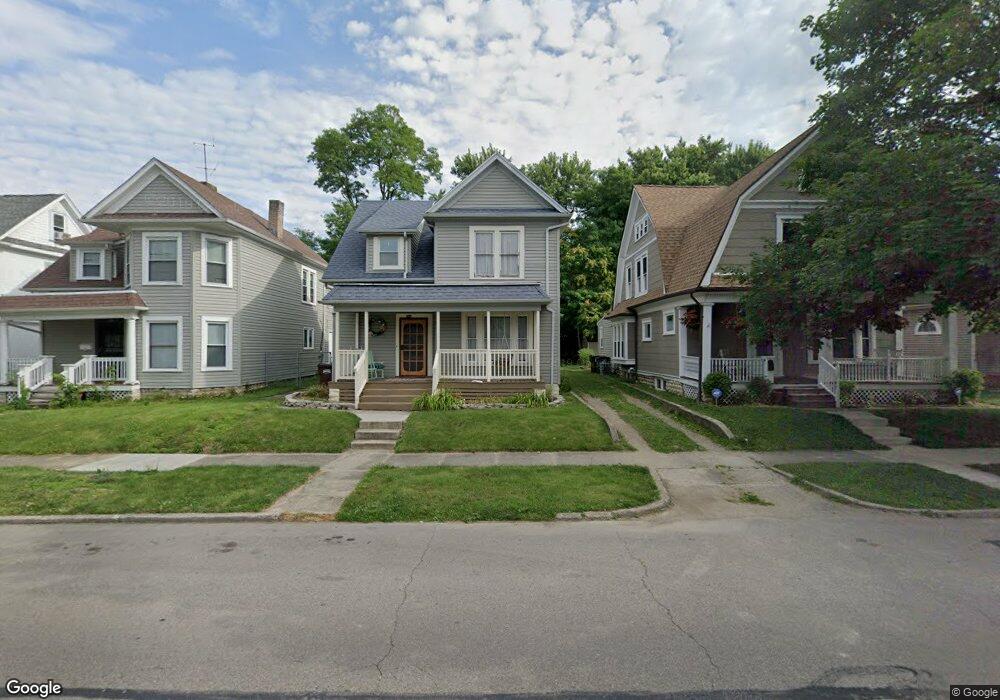
This home is located at 288 E 2nd St, Xenia, OH 45385 and is currently estimated at $130,101, approximately $85 per square foot. 288 E 2nd St is a home located in Greene County with nearby schools including Xenia High School, Summit Academy Community School for Alternative Learners - Xenia, and Legacy Christian Academy.
Ownership History
Date
Name
Owned For
Owner Type
Purchase Details
Closed on
May 26, 2016
Sold by
Davis Whitney E
Bought by
Hiles Rhonda P
Current Estimated Value
Purchase Details
Closed on
Mar 25, 1997
Sold by
Nunn Albert W
Bought by
Davis Whitney E
Home Financials for this Owner
Home Financials are based on the most recent Mortgage that was taken out on this home.
Original Mortgage
$43,650
Interest Rate
7.82%
Mortgage Type
New Conventional
Create a Home Valuation Report for This Property
The Home Valuation Report is an in-depth analysis detailing your home's value as well as a comparison with similar homes in the area
Home Values in the Area
Average Home Value in this Area
Purchase History
| Date | Buyer | Sale Price | Title Company |
|---|---|---|---|
| Hiles Rhonda P | $20,000 | Attorney | |
| Davis Whitney E | $45,000 | -- |
Source: Public Records
Mortgage History
| Date | Status | Borrower | Loan Amount |
|---|---|---|---|
| Previous Owner | Davis Whitney E | $43,650 |
Source: Public Records
Tax History
| Year | Tax Paid | Tax Assessment Tax Assessment Total Assessment is a certain percentage of the fair market value that is determined by local assessors to be the total taxable value of land and additions on the property. | Land | Improvement |
|---|---|---|---|---|
| 2024 | $1,758 | $40,370 | $3,620 | $36,750 |
| 2023 | $1,727 | $40,370 | $3,620 | $36,750 |
| 2022 | $1,513 | $30,160 | $2,890 | $27,270 |
| 2021 | $1,533 | $30,160 | $2,890 | $27,270 |
| 2020 | $601 | $30,160 | $2,890 | $27,270 |
| 2019 | $1,099 | $21,240 | $2,890 | $18,350 |
| 2018 | $1,103 | $7,000 | $2,890 | $4,110 |
| 2017 | $353 | $7,000 | $2,890 | $4,110 |
| 2016 | $1,096 | $21,260 | $2,890 | $18,370 |
| 2015 | $1,099 | $21,260 | $2,890 | $18,370 |
| 2014 | $1,051 | $21,260 | $2,890 | $18,370 |
Source: Public Records
Map
Nearby Homes
Your Personal Tour Guide
Ask me questions while you tour the home.