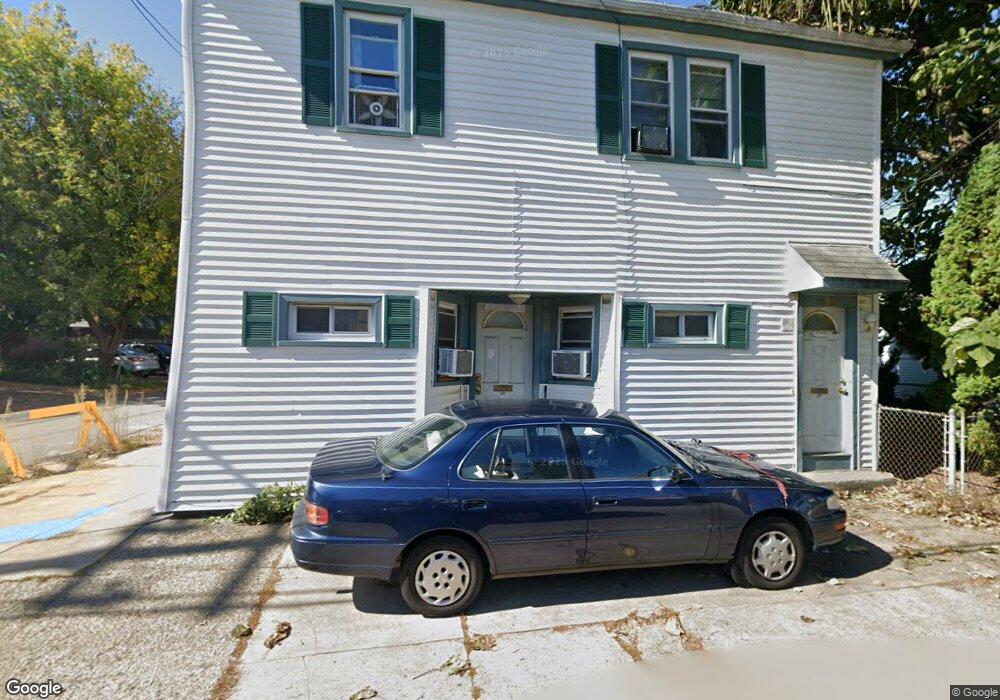
288 Mendon Ave Pawtucket, RI 02861
Darlington NeighborhoodEstimated Value: $385,218 - $502,000
4
Beds
2
Baths
3,081
Sq Ft
$151/Sq Ft
Est. Value
About This Home
This home is located at 288 Mendon Ave, Pawtucket, RI 02861 and is currently estimated at $466,555, approximately $151 per square foot. 288 Mendon Ave is a home located in Providence County with nearby schools including St Cecilia School and Saint Raphael Academy.
Ownership History
Date
Name
Owned For
Owner Type
Purchase Details
Closed on
Dec 28, 2023
Sold by
Cornerstonehldg Ri Llc
Bought by
Zp Holdings Llc and Nl Holdings Llc
Current Estimated Value
Purchase Details
Closed on
Nov 14, 2008
Sold by
Hsbc Bank Usa
Bought by
Faria Jeffrey R and Faria Cheryl A
Purchase Details
Closed on
Jun 24, 2008
Sold by
Tabiti Felicia
Bought by
Hsbc Bank Usa
Purchase Details
Closed on
Apr 27, 2006
Sold by
Rodriguez Rosa A
Bought by
Tabiti Felicia and Adediran Kazeem
Home Financials for this Owner
Home Financials are based on the most recent Mortgage that was taken out on this home.
Original Mortgage
$208,000
Interest Rate
6.4%
Mortgage Type
Purchase Money Mortgage
Create a Home Valuation Report for This Property
The Home Valuation Report is an in-depth analysis detailing your home's value as well as a comparison with similar homes in the area
Home Values in the Area
Average Home Value in this Area
Purchase History
| Date | Buyer | Sale Price | Title Company |
|---|---|---|---|
| Zp Holdings Llc | -- | None Available | |
| Faria Jeffrey R | $70,000 | -- | |
| Hsbc Bank Usa | $174,840 | -- | |
| Tabiti Felicia | $260,000 | -- |
Source: Public Records
Mortgage History
| Date | Status | Borrower | Loan Amount |
|---|---|---|---|
| Previous Owner | Tabiti Felicia | $208,000 | |
| Previous Owner | Tabiti Felicia | $52,000 |
Source: Public Records
Tax History Compared to Growth
Tax History
| Year | Tax Paid | Tax Assessment Tax Assessment Total Assessment is a certain percentage of the fair market value that is determined by local assessors to be the total taxable value of land and additions on the property. | Land | Improvement |
|---|---|---|---|---|
| 2025 | $4,120 | $313,300 | $113,400 | $199,900 |
| 2024 | $4,323 | $350,300 | $113,400 | $236,900 |
| 2023 | $4,316 | $254,800 | $87,300 | $167,500 |
| 2022 | $4,225 | $254,800 | $87,300 | $167,500 |
| 2021 | $4,225 | $254,800 | $87,300 | $167,500 |
| 2020 | $3,583 | $171,500 | $60,500 | $111,000 |
| 2019 | $3,583 | $171,500 | $60,500 | $111,000 |
| 2018 | $3,452 | $171,500 | $60,500 | $111,000 |
| 2017 | $3,008 | $132,400 | $46,500 | $85,900 |
| 2016 | $2,898 | $132,400 | $46,500 | $85,900 |
| 2015 | $2,898 | $132,400 | $46,500 | $85,900 |
| 2014 | $2,880 | $124,900 | $46,500 | $78,400 |
Source: Public Records
Map
Nearby Homes