Estimated Value: $647,000 - $880,487
3
Beds
3
Baths
4,078
Sq Ft
$184/Sq Ft
Est. Value
About This Home
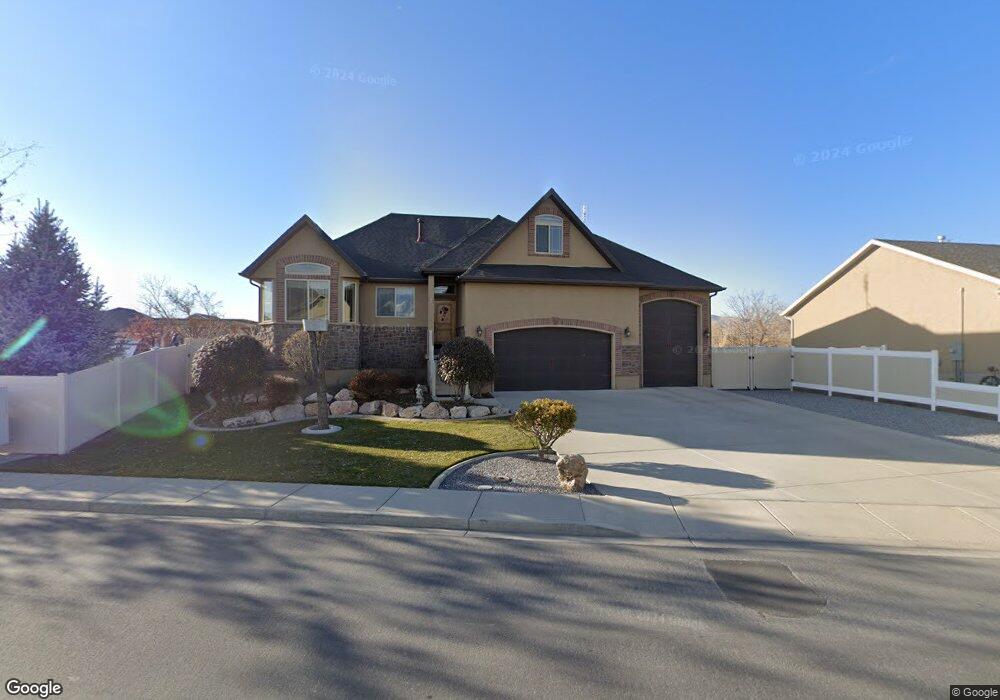
This home is located at 288 S Willow Ln, Lehi, UT 84043 and is currently estimated at $749,122, approximately $183 per square foot. 288 S Willow Ln is a home located in Utah County with nearby schools including Snow Springs Elementary, Willowcreek Middle School, and Lehi High School.
Ownership History
Date
Name
Owned For
Owner Type
Purchase Details
Closed on
Feb 5, 2008
Sold by
Southwick Mathew
Bought by
Southwick Vickie L and Southwick Mathew
Current Estimated Value
Home Financials for this Owner
Home Financials are based on the most recent Mortgage that was taken out on this home.
Original Mortgage
$417,000
Outstanding Balance
$249,829
Interest Rate
5.12%
Mortgage Type
New Conventional
Estimated Equity
$499,293
Purchase Details
Closed on
Jan 3, 2007
Sold by
Zabilanksy Scott
Bought by
Southwick Mathew
Home Financials for this Owner
Home Financials are based on the most recent Mortgage that was taken out on this home.
Original Mortgage
$0
Interest Rate
6.09%
Mortgage Type
Unknown
Purchase Details
Closed on
Dec 29, 2005
Sold by
Fieldstone Homes Utah Llc
Bought by
Zabilanksy Scott
Create a Home Valuation Report for This Property
The Home Valuation Report is an in-depth analysis detailing your home's value as well as a comparison with similar homes in the area
Home Values in the Area
Average Home Value in this Area
Purchase History
| Date | Buyer | Sale Price | Title Company |
|---|---|---|---|
| Southwick Vickie L | -- | Equity Title Production F | |
| Southwick Mathew | -- | None Available | |
| Zabilanksy Scott | -- | Bartlett Title Insurance Ag |
Source: Public Records
Mortgage History
| Date | Status | Borrower | Loan Amount |
|---|---|---|---|
| Open | Southwick Vickie L | $417,000 | |
| Closed | Southwick Mathew | $0 | |
| Closed | Southwick Mathew | $130,400 |
Source: Public Records
Tax History Compared to Growth
Tax History
| Year | Tax Paid | Tax Assessment Tax Assessment Total Assessment is a certain percentage of the fair market value that is determined by local assessors to be the total taxable value of land and additions on the property. | Land | Improvement |
|---|---|---|---|---|
| 2025 | $3,272 | $429,770 | $250,900 | $530,500 |
| 2024 | $3,272 | $382,910 | $0 | $0 |
| 2023 | $3,070 | $390,115 | $0 | $0 |
| 2022 | $3,145 | $387,365 | $0 | $0 |
| 2021 | $2,568 | $478,300 | $145,200 | $333,100 |
| 2020 | $2,421 | $445,700 | $134,400 | $311,300 |
| 2019 | $2,170 | $415,300 | $134,400 | $280,900 |
| 2018 | $2,134 | $386,000 | $121,400 | $264,600 |
| 2017 | $2,133 | $205,150 | $0 | $0 |
| 2016 | $2,272 | $202,785 | $0 | $0 |
| 2015 | $2,281 | $193,215 | $0 | $0 |
| 2014 | $1,995 | $167,970 | $0 | $0 |
Source: Public Records
Map
Nearby Homes
- 2817 W Willow Dr
- 472 S Olive Place
- 653 S Willow Park Dr
- 1247 N Baycrest Dr
- 2812 S Greenhead Dr
- 1244 N Willowbrook
- 603 S 2500 W
- The Roslyn Plan at Carla's Cove
- The Tracie Plan at Carla's Cove
- The Brooke Plan at Carla's Cove
- The Jackie Plan at Carla's Cove
- 3590 W Grassland Dr
- 1323 N Silvercrest Dr
- 203 E Jordan Ridge Blvd Unit 205
- 347 E Levengrove Dr Unit 1134
- 1496 N June St
- 341 E Levengrove Dr Unit 1133
- 335 E Levengrove Dr Unit 1132
- 251 Sunshine Dr
- 105 N 2430 W
- 268 S Willow Ln
- 3182 W Willow Reed Unit 34
- 3182 W Willow Reed Unit 138
- 218 S Willow Ln
- 218 S Willow Ln
- 3202 W Willow Reed
- 3202 W Willow Reed Unit 139
- 291 S Willow Ln
- 3148 W Willow Reed
- 281 S Willow Ln
- 3220 W Willow Reed Unit 140
- 3220 W Willow Reed
- 3126 W Willow Reed
- 3228 W Willow Reed Dr Unit 141
- 512 Willow Reed Unit 29
- 3119 Willow Way
- 3163 W Willow Reed
- 3238 W Willow Reed
- 3183 W Willow Reed Unit 147
- 3183 W Willow Reed