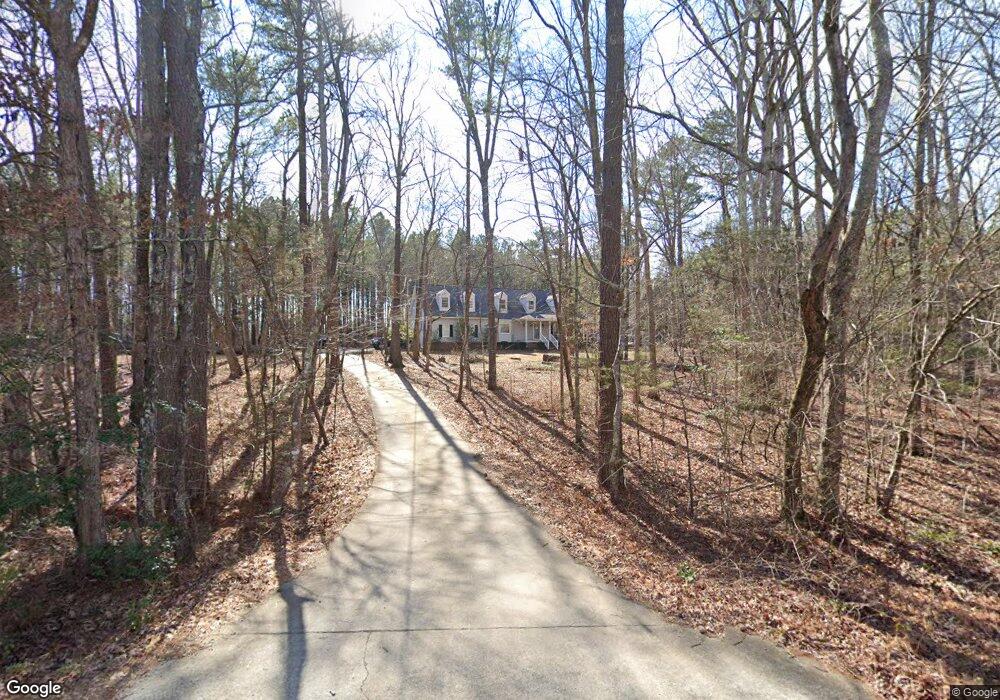
2880 Pete Roberson Rd Pittsboro, NC 27312
Estimated Value: $448,017 - $858,000
3
Beds
2
Baths
1,742
Sq Ft
$324/Sq Ft
Est. Value
About This Home
This home is located at 2880 Pete Roberson Rd, Pittsboro, NC 27312 and is currently estimated at $563,754, approximately $323 per square foot. 2880 Pete Roberson Rd is a home located in Chatham County with nearby schools including Pittsboro Elementary School, George Moses Horton Middle School, and Northwood High.
Ownership History
Date
Name
Owned For
Owner Type
Purchase Details
Closed on
Aug 25, 2009
Sold by
Perry Timothy C and Perry Kelli L
Bought by
Perry Timothy C and Perry Kelli L
Current Estimated Value
Create a Home Valuation Report for This Property
The Home Valuation Report is an in-depth analysis detailing your home's value as well as a comparison with similar homes in the area
Home Values in the Area
Average Home Value in this Area
Purchase History
| Date | Buyer | Sale Price | Title Company |
|---|---|---|---|
| Perry Timothy C | -- | None Available |
Source: Public Records
Tax History Compared to Growth
Tax History
| Year | Tax Paid | Tax Assessment Tax Assessment Total Assessment is a certain percentage of the fair market value that is determined by local assessors to be the total taxable value of land and additions on the property. | Land | Improvement |
|---|---|---|---|---|
| 2024 | $2,680 | $263,846 | $85,272 | $178,574 |
| 2023 | $2,183 | $263,846 | $85,272 | $178,574 |
| 2022 | $2,088 | $263,846 | $85,272 | $178,574 |
| 2021 | $2,213 | $263,846 | $85,272 | $178,574 |
| 2020 | $1,861 | $219,001 | $43,788 | $175,213 |
| 2019 | $1,861 | $219,001 | $43,788 | $175,213 |
| 2018 | $1,769 | $219,001 | $43,788 | $175,213 |
| 2017 | $1,769 | $219,001 | $43,788 | $175,213 |
| 2016 | $1,775 | $218,143 | $42,930 | $175,213 |
| 2015 | $1,749 | $218,143 | $42,930 | $175,213 |
| 2014 | $1,734 | $218,143 | $42,930 | $175,213 |
| 2013 | -- | $218,143 | $42,930 | $175,213 |
Source: Public Records
Map
Nearby Homes
- 0 Johnny Shaw Rd
- 272 Ambika Landing
- 168 Ambika Landing
- 240 Ambika Landing
- 823 Mays Chapel Rd
- 914 Taylors Chapel Rd
- 1191 Old Sanford Rd
- 2b Lucy Mae Page Rd
- 2693 Nc 902 Hwy
- 652 Old Sanford Rd
- 190 Louise Jenkins Rd
- 2693 N Carolina 902
- 320 Dewitt Smith Rd
- 0 River Forks Rd
- 652 Richardson Rd
- 206 Rocky Hills Rd
- 951 Walter Bright Rd
- 88 Daisy Scurlock Rd
- 75 Clarence Brooks Rd
- 1031 Walter Bright Rd
- 2935 Pete Roberson Rd
- 0 Thomas Mill Dr
- 64 Burns Way
- 172 Burns Way
- 0 Burns Way Unit 1642534
- 0 Burns Way Unit 1642266
- 00 Burns Way
- 0 Burns Way Unit 941942
- 0 Burns Way Unit 941943
- 0 Burns Way Unit 941944
- 0 Burns Way Unit 6&7 TR1642266
- 0 Burns Way Unit 7 1642534
- 00 Burns Way Unit 6
- 64 Burns Way Unit 6
- 172 Burns Way Unit 7
- 2592 Pete Roberson Rd
- 418 Thomas Mill Dr
- 416 Thomas Mill Dr
- 431 Burns Way
- 440 Thomas Mill Dr