Estimated Value: $294,034 - $376,000
4
Beds
3
Baths
1,252
Sq Ft
$262/Sq Ft
Est. Value
About This Home
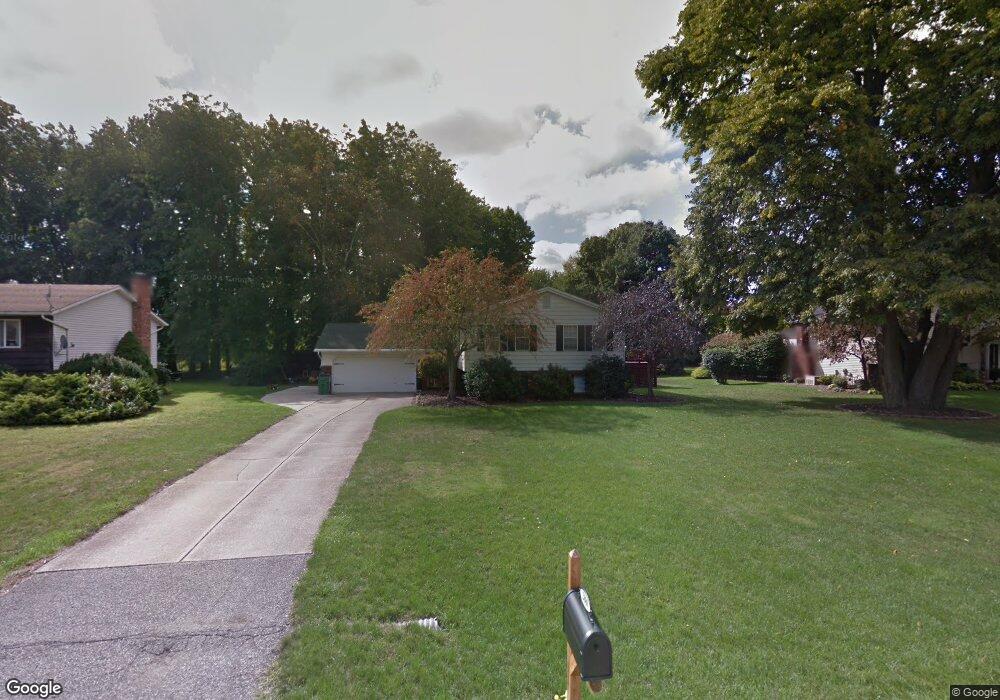
This home is located at 2880 Pine Ct, Perry, OH 44081 and is currently estimated at $328,009, approximately $261 per square foot. 2880 Pine Ct is a home located in Lake County with nearby schools including Perry Middle School, Perry High School, and Summit Academy Community School - Painesville.
Ownership History
Date
Name
Owned For
Owner Type
Purchase Details
Closed on
Aug 20, 2008
Sold by
Hoskin Michael D and Hoskin Deborah J
Bought by
Spring Dennis E and Spring Angela M
Current Estimated Value
Home Financials for this Owner
Home Financials are based on the most recent Mortgage that was taken out on this home.
Original Mortgage
$181,747
Outstanding Balance
$118,309
Interest Rate
6.42%
Mortgage Type
FHA
Estimated Equity
$209,700
Purchase Details
Closed on
Aug 13, 2004
Sold by
Johnston Eric R and Johnston Lynne L
Bought by
Hoskin Michael D
Home Financials for this Owner
Home Financials are based on the most recent Mortgage that was taken out on this home.
Original Mortgage
$165,600
Interest Rate
4.75%
Mortgage Type
Purchase Money Mortgage
Purchase Details
Closed on
Jun 24, 2003
Sold by
Johnston Eric R and Johnston Lynne L
Bought by
Johnston Eric R and Johnston Lynne L
Purchase Details
Closed on
Aug 29, 1975
Bought by
Johnston Eric R
Create a Home Valuation Report for This Property
The Home Valuation Report is an in-depth analysis detailing your home's value as well as a comparison with similar homes in the area
Purchase History
| Date | Buyer | Sale Price | Title Company |
|---|---|---|---|
| Spring Dennis E | $184,600 | Accent Ohio Land Title | |
| Hoskin Michael D | $207,000 | -- | |
| Johnston Eric R | -- | -- | |
| Johnston Eric R | -- | -- |
Source: Public Records
Mortgage History
| Date | Status | Borrower | Loan Amount |
|---|---|---|---|
| Open | Spring Dennis E | $181,747 | |
| Previous Owner | Hoskin Michael D | $165,600 |
Source: Public Records
Tax History
| Year | Tax Paid | Tax Assessment Tax Assessment Total Assessment is a certain percentage of the fair market value that is determined by local assessors to be the total taxable value of land and additions on the property. | Land | Improvement |
|---|---|---|---|---|
| 2025 | -- | $75,790 | $16,040 | $59,750 |
| 2024 | -- | $75,790 | $16,040 | $59,750 |
| 2023 | $5,883 | $68,110 | $13,370 | $54,740 |
| 2022 | $3,168 | $68,110 | $13,370 | $54,740 |
| 2021 | $3,019 | $69,210 | $14,470 | $54,740 |
| 2020 | $2,792 | $57,670 | $12,050 | $45,620 |
| 2019 | $2,794 | $57,670 | $12,050 | $45,620 |
| 2018 | $2,598 | $53,350 | $12,050 | $41,300 |
| 2017 | $2,571 | $53,350 | $12,050 | $41,300 |
| 2016 | $2,555 | $53,350 | $12,050 | $41,300 |
| 2015 | $2,554 | $53,350 | $12,050 | $41,300 |
| 2014 | $2,506 | $53,350 | $12,050 | $41,300 |
| 2013 | $2,505 | $53,350 | $12,050 | $41,300 |
Source: Public Records
Map
Nearby Homes
- 4300 Florida St
- 4423 Oregon St
- 1835 Royal Oak Dr
- 695 N Creek Dr
- 500 Park Rd
- V/L Morgan Dr
- 300 Manhattan Pkwy
- 396 Park Rd
- 1809 Muirfield Ln
- 1788 Kirtstone Terrace
- L 203 S Hidden Village Dr
- L 224 S Hidden Village Dr
- L 231 S Hidden Village Dr
- L 232 S Hidden Village Dr
- L 226 S Hidden Village Dr
- 0 N Ridge Rd Unit 5110949
- 751 Bacon Rd
- 797 Bacon Rd
- 264 Park Rd
- 4185 Maple St
Your Personal Tour Guide
Ask me questions while you tour the home.