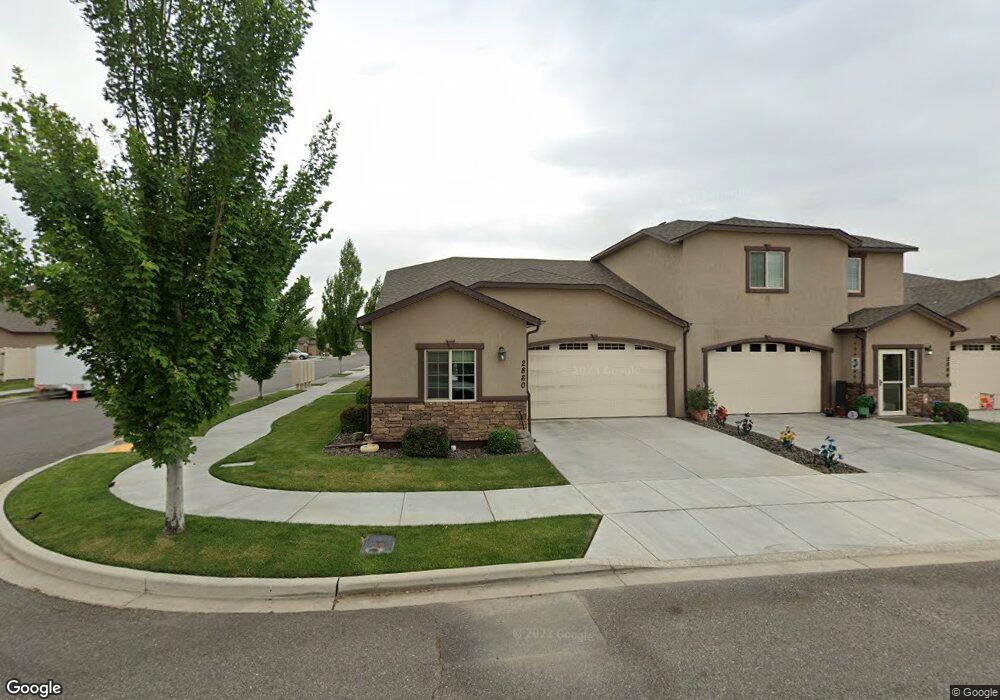
2880 S Dennis Place Unit MODEL HOME Kennewick, WA 99337
Estimated Value: $327,000 - $396,000
3
Beds
2
Baths
1,343
Sq Ft
$263/Sq Ft
Est. Value
About This Home
This home is located at 2880 S Dennis Place Unit MODEL HOME, Kennewick, WA 99337 and is currently estimated at $352,592, approximately $262 per square foot. 2880 S Dennis Place Unit MODEL HOME is a home located in Benton County with nearby schools including Southgate Elementary School, Horse Heaven Hills Middle School, and Southridge High School.
Ownership History
Date
Name
Owned For
Owner Type
Purchase Details
Closed on
Aug 6, 2020
Sold by
Aguirre Sarver Denise A and Sarver Mark W
Bought by
Campbell Joni and Dudley Toni
Current Estimated Value
Home Financials for this Owner
Home Financials are based on the most recent Mortgage that was taken out on this home.
Original Mortgage
$258,236
Outstanding Balance
$229,496
Interest Rate
3.1%
Mortgage Type
FHA
Estimated Equity
$123,096
Purchase Details
Closed on
Jun 21, 2018
Sold by
Hall Jeffey E and Hall Suzanne M
Bought by
Aguirre Sarver Denise A and Sarver Mark W
Purchase Details
Closed on
May 26, 2016
Sold by
Green Plan Construction Llc
Bought by
Hall Jeffrey E and Hall Suzanne M
Home Financials for this Owner
Home Financials are based on the most recent Mortgage that was taken out on this home.
Original Mortgage
$195,000
Interest Rate
3.61%
Mortgage Type
New Conventional
Create a Home Valuation Report for This Property
The Home Valuation Report is an in-depth analysis detailing your home's value as well as a comparison with similar homes in the area
Home Values in the Area
Average Home Value in this Area
Purchase History
| Date | Buyer | Sale Price | Title Company |
|---|---|---|---|
| Campbell Joni | $263,000 | Ticor Title Co | |
| Aguirre Sarver Denise A | $269,908 | Benton Franklin Title Co | |
| Hall Jeffrey E | $210,000 | Benton Franklin Title Co |
Source: Public Records
Mortgage History
| Date | Status | Borrower | Loan Amount |
|---|---|---|---|
| Open | Campbell Joni | $258,236 | |
| Previous Owner | Hall Jeffrey E | $195,000 |
Source: Public Records
Tax History Compared to Growth
Tax History
| Year | Tax Paid | Tax Assessment Tax Assessment Total Assessment is a certain percentage of the fair market value that is determined by local assessors to be the total taxable value of land and additions on the property. | Land | Improvement |
|---|---|---|---|---|
| 2024 | $2,209 | $275,040 | $40,000 | $235,040 |
| 2023 | $2,209 | $275,040 | $40,000 | $235,040 |
| 2022 | $2,164 | $253,670 | $40,000 | $213,670 |
| 2021 | $1,957 | $220,810 | $50,000 | $170,810 |
| 2020 | $2,044 | $193,480 | $50,000 | $143,480 |
| 2019 | $2,137 | $193,480 | $50,000 | $143,480 |
| 2018 | $2,351 | $207,150 | $50,000 | $157,150 |
| 2017 | $2,038 | $186,650 | $50,000 | $136,650 |
| 2016 | $2,151 | $176,120 | $30,000 | $146,120 |
| 2015 | $2,164 | $176,120 | $30,000 | $146,120 |
| 2014 | -- | $176,120 | $30,000 | $146,120 |
| 2013 | -- | $5,020 | $5,020 | $0 |
Source: Public Records
Map
Nearby Homes
- 6626 W 30th Place
- 6150 W 30th Place
- 6659 W 30th Place
- 2759 W 30th Place
- 2608 S Anderson St
- 2302 W 31st Ave
- 2804 S Huntington Ct
- 3435 S Dennis St
- 3504 S Fisher Ct
- 3101 W 34th Ave
- 3121 W 30th Ave Unit L 102
- 3121 W 30th Ave Unit G-101
- 3467 S Dennis St
- 3516 S Fisher Ct
- 3304 S Vancouver Place
- 3416 S Irby St
- 2808 S Underwood St
- 2214 S Zillah Place
- 2237 W 23rd Ave
- 320 W Canyon Lakes Dr
- 2880 S Dennis Place
- 2864 S Dennis Place
- 2864 S Dennis Place Unit Pre Sale
- 2848 S Dennis Place
- 2848 S Dennis Place Unit Pre Sale
- 6069 W 30th Place
- 6053 W 30th Place
- 6060 W 30th Place
- 6084 W 30th Place
- 6092 W 30th Place
- 6174 W 30th Place
- 6182 W 30th Place
- 6265 W 30th Place
- 6061 W 30th Place
- 6197 W 30th Place
- 6190 W 30th Place
- 2734 W 30th Place
- 3018 S Dennis Place
- 3018 S Dennis Place Unit Awesome Location!
- 2832 S Dennis Place