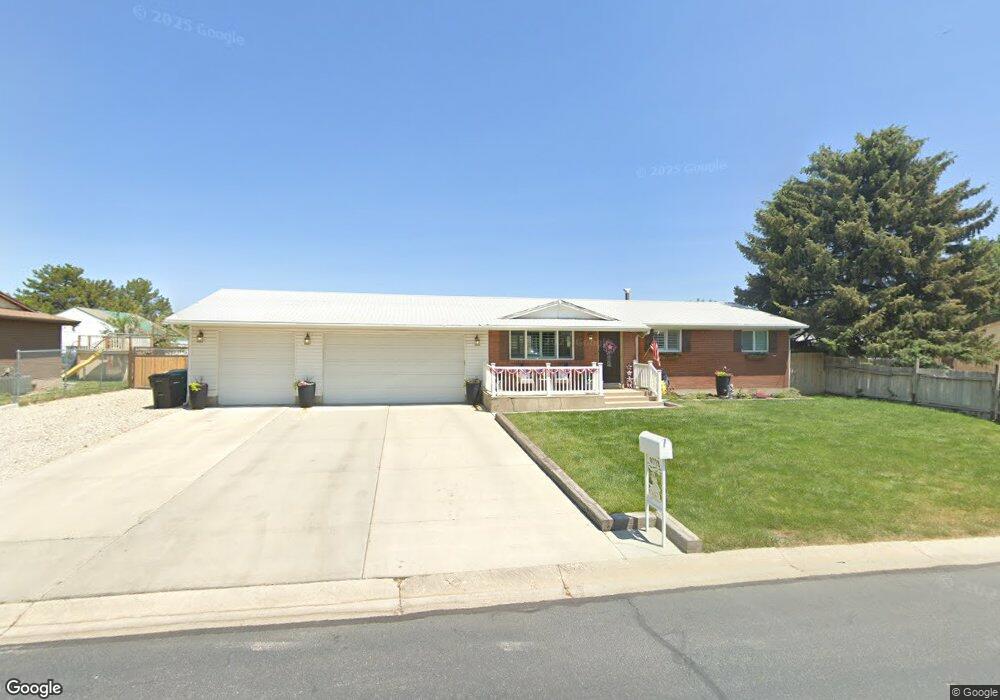
2880 W 7268 S West Jordan, UT 84084
Estimated Value: $526,000 - $661,000
4
Beds
2
Baths
2,000
Sq Ft
$295/Sq Ft
Est. Value
About This Home
This home is located at 2880 W 7268 S, West Jordan, UT 84084 and is currently estimated at $589,930, approximately $294 per square foot. 2880 W 7268 S is a home located in Salt Lake County with nearby schools including Westland Elementary School, West Jordan Middle School, and West Jordan High School.
Ownership History
Date
Name
Owned For
Owner Type
Purchase Details
Closed on
Oct 30, 2017
Sold by
Timm Taylor W
Bought by
Timm Taylor W and Timm Abigale Jo
Current Estimated Value
Home Financials for this Owner
Home Financials are based on the most recent Mortgage that was taken out on this home.
Original Mortgage
$294,500
Outstanding Balance
$246,319
Interest Rate
3.78%
Mortgage Type
New Conventional
Estimated Equity
$343,611
Purchase Details
Closed on
Oct 27, 2017
Sold by
Morandy Dennis John and Morandy Susan
Bought by
Timm Taylro W
Home Financials for this Owner
Home Financials are based on the most recent Mortgage that was taken out on this home.
Original Mortgage
$294,500
Outstanding Balance
$246,319
Interest Rate
3.78%
Mortgage Type
New Conventional
Estimated Equity
$343,611
Purchase Details
Closed on
Feb 28, 1995
Sold by
Williams Devin G and Williams Trinna
Bought by
Morandy Dennis John and Morandy Susan
Create a Home Valuation Report for This Property
The Home Valuation Report is an in-depth analysis detailing your home's value as well as a comparison with similar homes in the area
Home Values in the Area
Average Home Value in this Area
Purchase History
| Date | Buyer | Sale Price | Title Company |
|---|---|---|---|
| Timm Taylor W | -- | Accommodation | |
| Timm Taylro W | -- | Inwest Title Services | |
| Morandy Dennis John | -- | -- |
Source: Public Records
Mortgage History
| Date | Status | Borrower | Loan Amount |
|---|---|---|---|
| Open | Timm Taylor W | $294,500 |
Source: Public Records
Tax History Compared to Growth
Tax History
| Year | Tax Paid | Tax Assessment Tax Assessment Total Assessment is a certain percentage of the fair market value that is determined by local assessors to be the total taxable value of land and additions on the property. | Land | Improvement |
|---|---|---|---|---|
| 2025 | $2,617 | $539,400 | $207,500 | $331,900 |
| 2024 | $2,617 | $503,600 | $199,500 | $304,100 |
| 2023 | $2,617 | $503,200 | $197,500 | $305,700 |
| 2022 | $2,827 | $504,300 | $193,700 | $310,600 |
| 2021 | $1,805 | $293,100 | $161,400 | $131,700 |
| 2020 | $1,817 | $276,900 | $161,400 | $115,500 |
| 2019 | $1,871 | $264,000 | $135,600 | $128,400 |
| 2018 | $1,991 | $295,100 | $126,300 | $168,800 |
| 2017 | $1,633 | $241,000 | $126,300 | $114,700 |
| 2016 | $1,730 | $239,900 | $126,300 | $113,600 |
| 2015 | $1,871 | $253,000 | $128,600 | $124,400 |
| 2014 | $1,707 | $227,200 | $116,600 | $110,600 |
Source: Public Records
Map
Nearby Homes
- 7361 S 2700 W
- 2886 W 7550 S
- 8524 S Michele River Ave W Unit 109
- 2573 Jordan Meadows Ln
- 7604 S Autumn Dr
- 2510 W Jordan Meadows Ln
- 7721 Sunset Cir
- 6918 S Harvest Cir
- 6893 S 3200 W
- 7647 S 2500 W
- 3165 W 7720 S
- 2312 W Hidden Bend Cove Unit 107
- 7611 S Springbrook Dr
- 2421 W 6900 S
- 2386 W 7680 S
- 2683 W Carson Ln
- 7122 S Wood Green Rd
- 3383 W 6880 S
- 3354 W 7800 S
- 3066 W Linton Dr