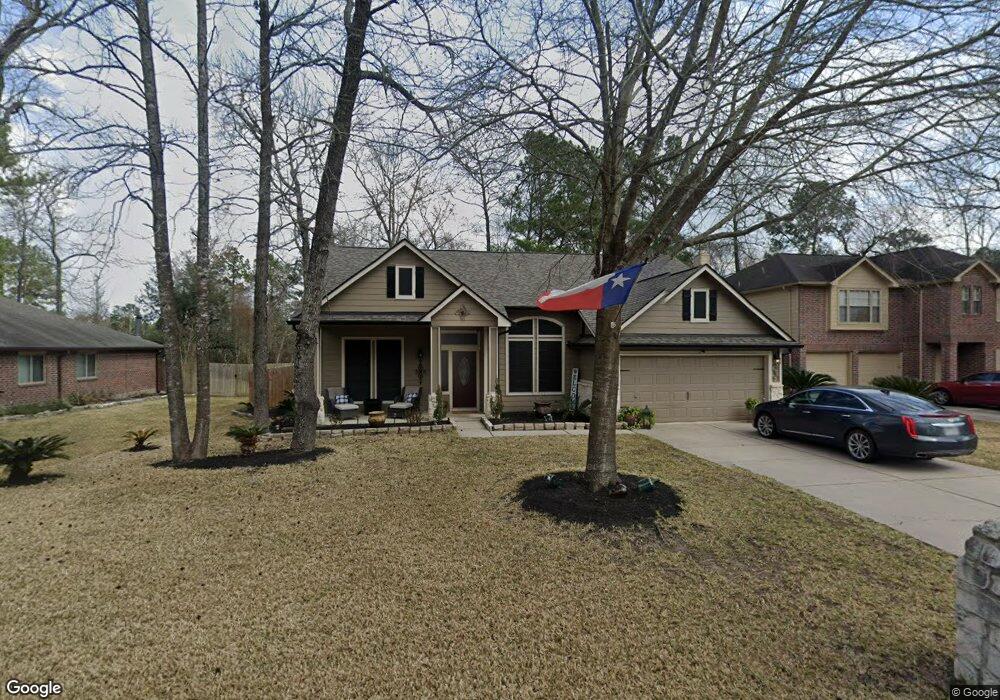
28806 Pine Forest Dr Magnolia, TX 77355
Estimated Value: $292,000 - $330,000
3
Beds
2
Baths
1,719
Sq Ft
$180/Sq Ft
Est. Value
About This Home
This home is located at 28806 Pine Forest Dr, Magnolia, TX 77355 and is currently estimated at $310,268, approximately $180 per square foot. 28806 Pine Forest Dr is a home located in Montgomery County with nearby schools including Nichols Sawmill Elementary School, Magnolia Sixth Grade Campus, and Magnolia Junior High School.
Ownership History
Date
Name
Owned For
Owner Type
Purchase Details
Closed on
Nov 21, 2003
Sold by
Williams Carl L and Williams Julie A
Bought by
Hoyt Thomas and Hoyt Josephine
Current Estimated Value
Home Financials for this Owner
Home Financials are based on the most recent Mortgage that was taken out on this home.
Original Mortgage
$115,785
Outstanding Balance
$53,902
Interest Rate
6.06%
Mortgage Type
Purchase Money Mortgage
Estimated Equity
$256,366
Purchase Details
Closed on
Apr 29, 1998
Sold by
Royce Homes Inc
Bought by
Williams Carl L and Williams Julie A
Home Financials for this Owner
Home Financials are based on the most recent Mortgage that was taken out on this home.
Original Mortgage
$103,300
Interest Rate
7.09%
Purchase Details
Closed on
Sep 1, 1982
Bought by
Hoyt Thomas and Hoyt Josephine
Create a Home Valuation Report for This Property
The Home Valuation Report is an in-depth analysis detailing your home's value as well as a comparison with similar homes in the area
Home Values in the Area
Average Home Value in this Area
Purchase History
| Date | Buyer | Sale Price | Title Company |
|---|---|---|---|
| Hoyt Thomas | -- | Stewart Title | |
| Williams Carl L | -- | Stewart Title | |
| Hoyt Thomas | -- | -- |
Source: Public Records
Mortgage History
| Date | Status | Borrower | Loan Amount |
|---|---|---|---|
| Open | Hoyt Thomas | $115,785 | |
| Previous Owner | Williams Carl L | $103,300 |
Source: Public Records
Tax History Compared to Growth
Tax History
| Year | Tax Paid | Tax Assessment Tax Assessment Total Assessment is a certain percentage of the fair market value that is determined by local assessors to be the total taxable value of land and additions on the property. | Land | Improvement |
|---|---|---|---|---|
| 2025 | $5,522 | $269,840 | $58,000 | $211,840 |
| 2024 | $2,569 | $261,481 | -- | -- |
| 2023 | $2,569 | $237,710 | $58,000 | $204,840 |
| 2022 | $6,234 | $216,100 | $58,000 | $183,660 |
| 2021 | $5,852 | $196,450 | $36,000 | $162,740 |
| 2020 | $5,775 | $178,590 | $36,000 | $155,830 |
| 2019 | $5,234 | $162,350 | $36,000 | $126,350 |
| 2018 | $4,623 | $154,530 | $36,000 | $118,530 |
| 2017 | $5,296 | $157,140 | $36,000 | $121,140 |
| 2016 | $5,065 | $150,270 | $12,000 | $138,270 |
| 2015 | $4,267 | $144,560 | $12,000 | $132,560 |
| 2014 | $4,267 | $131,990 | $12,000 | $119,990 |
Source: Public Records
Map
Nearby Homes
- 28915 Pine Forest Dr
- TBD Legacy Ct
- 29010 Legacy Ct
- 28915 Forest Hill Dr
- 28418 Teal Ct
- 42 Brookefield Cir
- 59 Beaconsfield Dr
- 28028 Crossway Oaks
- 28046 Crossway Oaks
- 19803 Ruby Terrace Ln
- 0 Country Place Unit 33111380
- TBD Fm 1774 Rd
- 18903 Veterans Rd
- 28208 Nichols Sawmill Rd
- Resolution 3K Plan at Waterford Run - Clayton
- Colossal Plan at Waterford Run - Clayton
- The Jackson Plan at Waterford Run - Jessup
- Crazy Eights Plan at Waterford Run - Clayton
- 18631 Mink Lake Dr
- 16715 Frosted Evergreen Ct
- 28810 Pine Forest Dr
- 28802 Pine Forest Dr
- 19014 Forest Ridge Dr
- 28814 Pine Forest Dr
- 28807 Pine Forest Dr
- 28803 Pine Forest Dr
- 28818 Pine Forest Dr
- 28815 Pine Forest Dr
- 19106 Forest Ridge Dr
- 28822 Pine Forest Dr
- 19019 Forest Ridge Dr
- 19023 Forest Ridge Dr
- 19015 Forest Ridge Dr
- 19027 Forest Ridge Dr
- 19027 Forest Ridge Dr
- 19110 Forest Ridge Dr
- 28823 Pine Forest Dr
- 28902 Pine Forest Dr
- 19103 Forest Ridge Dr
- 28810 Ashbrook Ln