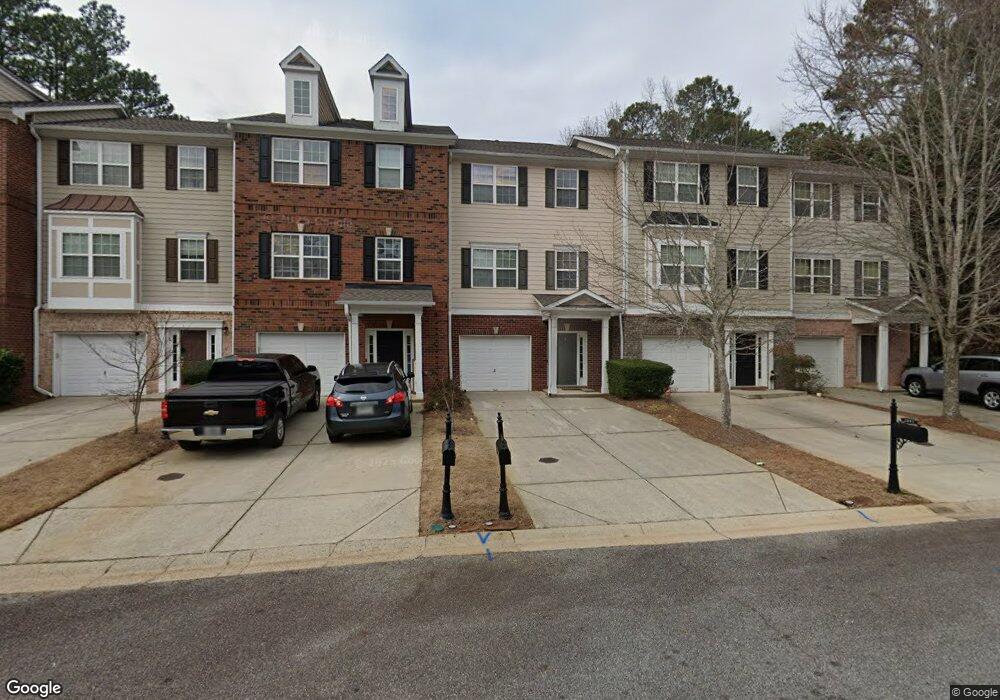
2881 Cross Creek Ct Unit 2 Cumming, GA 30040
Estimated Value: $416,000 - $436,000
3
Beds
4
Baths
2,090
Sq Ft
$204/Sq Ft
Est. Value
About This Home
This home is located at 2881 Cross Creek Ct Unit 2, Cumming, GA 30040 and is currently estimated at $427,010, approximately $204 per square foot. 2881 Cross Creek Ct Unit 2 is a home located in Forsyth County with nearby schools including Piney Grove Middle School, Denmark High School, and Alpharetta Tamil School.
Ownership History
Date
Name
Owned For
Owner Type
Purchase Details
Closed on
Dec 3, 2018
Sold by
Smith Amanda
Bought by
Joyner Jay E
Current Estimated Value
Home Financials for this Owner
Home Financials are based on the most recent Mortgage that was taken out on this home.
Original Mortgage
$191,250
Outstanding Balance
$168,495
Interest Rate
4.8%
Mortgage Type
New Conventional
Estimated Equity
$258,515
Purchase Details
Closed on
Jun 24, 2016
Sold by
Danielle L
Bought by
Smith Amanda
Home Financials for this Owner
Home Financials are based on the most recent Mortgage that was taken out on this home.
Original Mortgage
$181,080
Interest Rate
3.64%
Mortgage Type
New Conventional
Purchase Details
Closed on
Nov 27, 2012
Sold by
Beuke Michael Scott
Bought by
Moore Danielle and Moore Christopher Peter
Purchase Details
Closed on
Oct 31, 2012
Sold by
Beuke Michael S
Bought by
Moore Danielle L and Moore Christopher P
Create a Home Valuation Report for This Property
The Home Valuation Report is an in-depth analysis detailing your home's value as well as a comparison with similar homes in the area
Home Values in the Area
Average Home Value in this Area
Purchase History
| Date | Buyer | Sale Price | Title Company |
|---|---|---|---|
| Joyner Jay E | $225,000 | -- | |
| Smith Amanda | $201,200 | -- | |
| Moore Danielle | $163,048 | -- | |
| Moore Danielle L | -- | -- |
Source: Public Records
Mortgage History
| Date | Status | Borrower | Loan Amount |
|---|---|---|---|
| Open | Joyner Jay E | $191,250 | |
| Previous Owner | Smith Amanda | $181,080 |
Source: Public Records
Tax History Compared to Growth
Tax History
| Year | Tax Paid | Tax Assessment Tax Assessment Total Assessment is a certain percentage of the fair market value that is determined by local assessors to be the total taxable value of land and additions on the property. | Land | Improvement |
|---|---|---|---|---|
| 2025 | $3,358 | $170,140 | $78,000 | $92,140 |
| 2024 | $3,358 | $163,792 | $66,000 | $97,792 |
| 2023 | $2,786 | $151,676 | $56,000 | $95,676 |
| 2022 | $2,876 | $101,284 | $32,000 | $69,284 |
| 2021 | $2,598 | $101,284 | $32,000 | $69,284 |
| 2020 | $2,586 | $100,696 | $32,000 | $68,696 |
| 2019 | $2,368 | $90,000 | $21,000 | $69,000 |
| 2018 | $2,194 | $85,676 | $20,000 | $65,676 |
| 2017 | $2,139 | $82,704 | $20,000 | $62,704 |
| 2016 | $2,008 | $72,344 | $20,000 | $52,344 |
| 2015 | $1,831 | $65,864 | $16,000 | $49,864 |
| 2014 | $1,577 | $59,556 | $0 | $0 |
Source: Public Records
Map
Nearby Homes
- 2872 Cross Creek Ct
- 2913 Greyhawk Ln
- 2892 Cross Creek Dr
- 2881 Cross Creek Dr Unit 162
- 2945 Greyhawk Ln Unit 3
- 2951 Greyhawk Ln
- 3715 Baguette Ct Unit 102
- 3153 Cross Creek Dr
- 3080 Whitfield Ave
- 2702 Wollerton St Unit 2702
- 2503 Wollerton St Unit 2503
- 1001 Calypso Way Unit 1001
- 2964 Greyhawk Ln Unit 160
- 3112 Cross Creek Dr Unit 68
- 1601 Bonica Crossing Rd Unit 1601
- 3211 Glen Wallace Dr
- 1702 Bonica Crossing Unit 1702
- 6410 Oak Valley Dr
- Kendrick Plan at Courtyards at Traditions
- Redford Plan at Courtyards at Traditions
- 2881 Cross Creek Ct
- 2881 Cross Creek Ct Unit 2881
- 2879 Cross Creek Ct
- 2883 Cross Creek Ct
- 2885 Cross Creek Ct
- 2877 Cross Creek Ct
- 2875 Cross Creek Ct Unit 7
- 2875 Cross Creek Ct
- 2894 Cross Creek Ct
- 2871 Cross Creek Ct Unit 6
- 2871 Cross Creek Ct Unit 2871
- 2871 Cross Creek Ct
- 2890 Cross Creek Ct
- 2892 Cross Creek Ct
- 2869 Cross Creek Ct
- 2888 Cross Creek Ct
- 2882 Cross Creek Ct
- 2884 Cross Creek Ct Unit 18
- 2884 Cross Creek Ct
- 2880 Cross Creek Ct