Estimated Value: $408,610 - $441,000
4
Beds
2
Baths
1,620
Sq Ft
$262/Sq Ft
Est. Value
About This Home
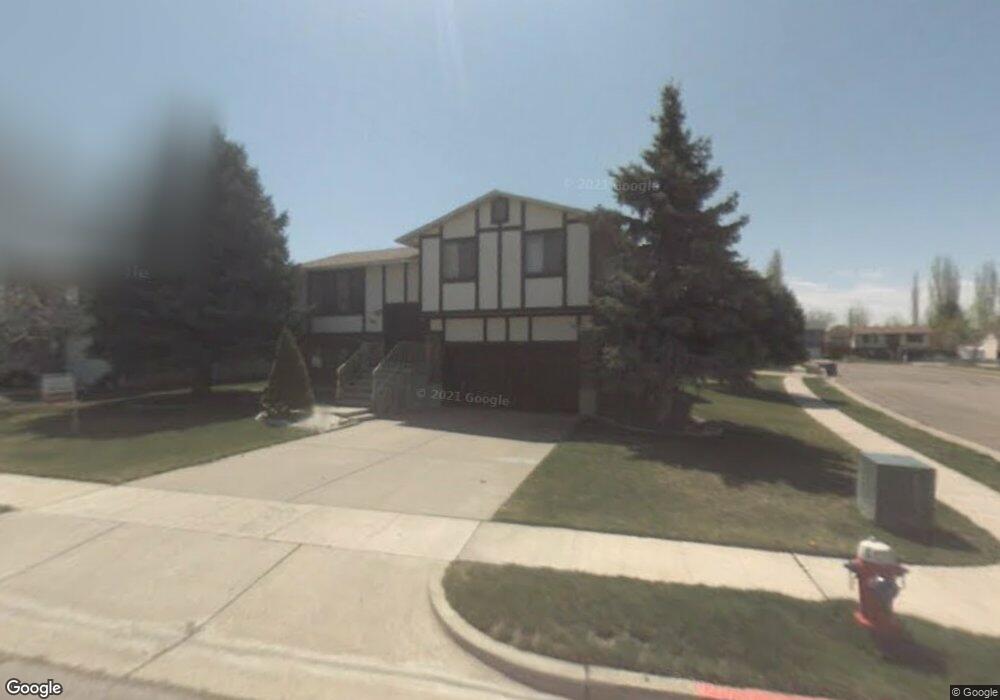
This home is located at 2881 W 5775 S, Roy, UT 84067 and is currently estimated at $423,903, approximately $261 per square foot. 2881 W 5775 S is a home located in Weber County with nearby schools including Roy Elementary School, Roy Junior High School, and Roy High School.
Ownership History
Date
Name
Owned For
Owner Type
Purchase Details
Closed on
Nov 20, 2008
Sold by
Northern Regal Homes Inc
Bought by
Byler Simon H and Byler Jillian F
Current Estimated Value
Home Financials for this Owner
Home Financials are based on the most recent Mortgage that was taken out on this home.
Original Mortgage
$168,445
Outstanding Balance
$109,583
Interest Rate
5.9%
Mortgage Type
VA
Estimated Equity
$314,320
Purchase Details
Closed on
Apr 25, 2008
Sold by
Sanchez Bonifacio G and Sanchez Lorena T
Bought by
Northern Regal Homes Inc
Purchase Details
Closed on
Oct 1, 1997
Sold by
Roskelley Delynn and Roskelley Lana
Bought by
Sanchez Bonifacio G and Sanchez Lorena T
Home Financials for this Owner
Home Financials are based on the most recent Mortgage that was taken out on this home.
Original Mortgage
$92,000
Interest Rate
7.44%
Create a Home Valuation Report for This Property
The Home Valuation Report is an in-depth analysis detailing your home's value as well as a comparison with similar homes in the area
Home Values in the Area
Average Home Value in this Area
Purchase History
| Date | Buyer | Sale Price | Title Company |
|---|---|---|---|
| Byler Simon H | -- | Executive Title Ogden | |
| Northern Regal Homes Inc | -- | Heritage West Title Ins | |
| Sanchez Bonifacio G | -- | Backman Stewart Title |
Source: Public Records
Mortgage History
| Date | Status | Borrower | Loan Amount |
|---|---|---|---|
| Open | Byler Simon H | $168,445 | |
| Previous Owner | Sanchez Bonifacio G | $92,000 |
Source: Public Records
Tax History Compared to Growth
Tax History
| Year | Tax Paid | Tax Assessment Tax Assessment Total Assessment is a certain percentage of the fair market value that is determined by local assessors to be the total taxable value of land and additions on the property. | Land | Improvement |
|---|---|---|---|---|
| 2025 | $2,527 | $398,921 | $114,121 | $284,800 |
| 2024 | $2,465 | $215,599 | $62,780 | $152,819 |
| 2023 | $2,408 | $211,200 | $64,368 | $146,832 |
| 2022 | $2,247 | $201,300 | $53,042 | $148,258 |
| 2021 | $1,949 | $288,000 | $62,435 | $225,565 |
| 2020 | $1,775 | $240,000 | $62,435 | $177,565 |
| 2019 | $1,743 | $222,000 | $37,944 | $184,056 |
| 2018 | $1,626 | $194,000 | $35,042 | $158,958 |
| 2017 | $1,558 | $174,121 | $34,171 | $139,950 |
| 2016 | $1,446 | $86,379 | $18,726 | $67,653 |
| 2015 | $1,264 | $76,323 | $18,726 | $57,597 |
| 2014 | $1,275 | $76,323 | $18,726 | $57,597 |
Source: Public Records
Map
Nearby Homes