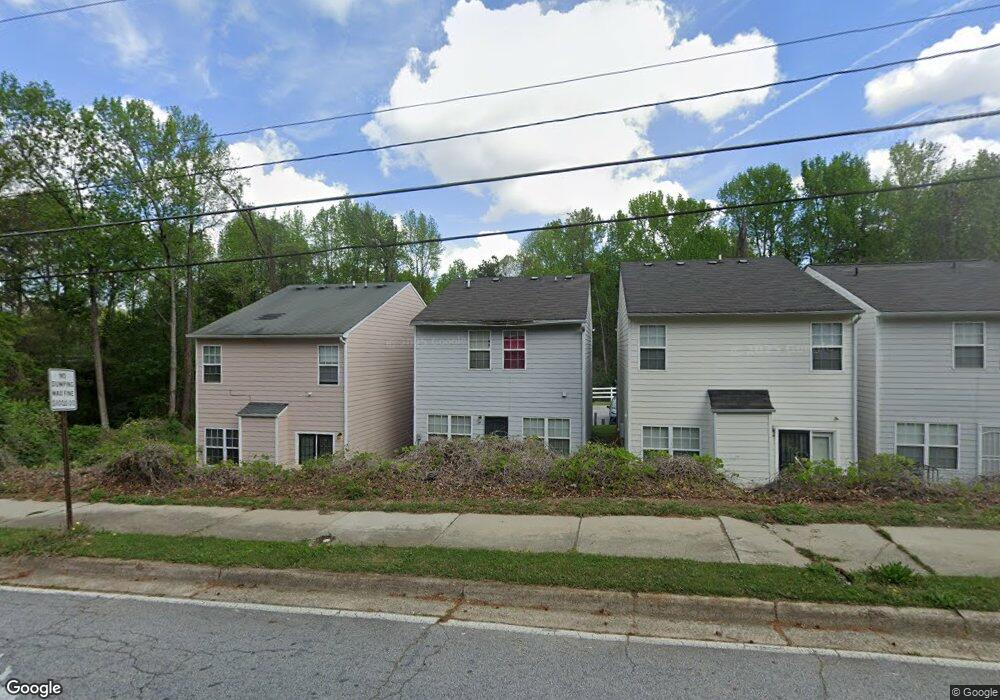
2881 Windsor Forrest Ct College Park, GA 30349
Estimated Value: $208,906 - $237,000
3
Beds
3
Baths
1,460
Sq Ft
$152/Sq Ft
Est. Value
About This Home
This home is located at 2881 Windsor Forrest Ct, College Park, GA 30349 and is currently estimated at $221,227, approximately $151 per square foot. 2881 Windsor Forrest Ct is a home located in Fulton County with nearby schools including Heritage Elementary School, Woodland Middle School, and Banneker High School.
Ownership History
Date
Name
Owned For
Owner Type
Purchase Details
Closed on
Nov 23, 2021
Sold by
Cicarelli Daniel
Bought by
2 Godby Llc
Current Estimated Value
Purchase Details
Closed on
Nov 4, 2011
Sold by
Adebuga Samuel
Bought by
Cicarelli Daniel
Purchase Details
Closed on
Aug 19, 2011
Sold by
Secretary Of Housing And U
Bought by
Adebuga Samuel
Purchase Details
Closed on
Mar 2, 2010
Sold by
Peete Maricceo D
Bought by
Emc Mtg Corp
Purchase Details
Closed on
Jan 5, 2010
Sold by
Suntrust Mtg Inc
Bought by
Hud-Housing Of Urban Dev
Purchase Details
Closed on
Apr 29, 2004
Sold by
Choice Homes Inc
Bought by
Maynor Tonka
Home Financials for this Owner
Home Financials are based on the most recent Mortgage that was taken out on this home.
Original Mortgage
$116,950
Interest Rate
5.77%
Mortgage Type
VA
Purchase Details
Closed on
Dec 9, 2003
Sold by
Godby Rd Venture Llc
Bought by
Choice Hms Inc
Create a Home Valuation Report for This Property
The Home Valuation Report is an in-depth analysis detailing your home's value as well as a comparison with similar homes in the area
Home Values in the Area
Average Home Value in this Area
Purchase History
| Date | Buyer | Sale Price | Title Company |
|---|---|---|---|
| 2 Godby Llc | -- | -- | |
| Cicarelli Daniel | $25,000 | -- | |
| Adebuga Samuel | $25,000 | -- | |
| Emc Mtg Corp | $3,900 | -- | |
| Hud-Housing Of Urban Dev | -- | -- | |
| Federal Natl Mtg Assn Fnma | -- | -- | |
| Suntrust Mtg Inc | $114,497 | -- | |
| Maynor Tonka | $118,900 | -- | |
| Choice Hms Inc | $50,600 | -- |
Source: Public Records
Mortgage History
| Date | Status | Borrower | Loan Amount |
|---|---|---|---|
| Previous Owner | Maynor Tonka | $116,950 |
Source: Public Records
Tax History Compared to Growth
Tax History
| Year | Tax Paid | Tax Assessment Tax Assessment Total Assessment is a certain percentage of the fair market value that is determined by local assessors to be the total taxable value of land and additions on the property. | Land | Improvement |
|---|---|---|---|---|
| 2025 | $2,221 | $85,080 | $23,640 | $61,440 |
| 2023 | $2,583 | $91,520 | $23,280 | $68,240 |
| 2022 | $1,339 | $50,880 | $8,120 | $42,760 |
| 2021 | $1,340 | $49,400 | $7,880 | $41,520 |
| 2020 | $1,161 | $41,760 | $5,520 | $36,240 |
| 2019 | $418 | $33,120 | $5,080 | $28,040 |
| 2018 | $749 | $26,520 | $4,160 | $22,360 |
| 2017 | $743 | $25,480 | $4,000 | $21,480 |
| 2016 | $744 | $25,480 | $4,000 | $21,480 |
| 2015 | $1,068 | $25,480 | $4,000 | $21,480 |
| 2014 | $494 | $16,120 | $3,120 | $13,000 |
Source: Public Records
Map
Nearby Homes
- 2849 Windsor Forrest Ct
- 3120 Godby Rd Unit 1132
- 3120 Godby Rd
- 5074 Windsor Forrest Ln
- 5072 Windsor Forrest Ln
- 5057 Windsor Forrest Ln
- 2765 Live Oak Trail
- 5149 Seashell Ln
- 5157 Seashell Ln
- 5342 Sand Bar Ln
- 2999 Roosevelt Hwy
- 6845 Old National Hwy
- 2595 Northfield Ct
- 5425 Westford Cir
- 5337 Jerome Rd
- 5430 Old Bill Cook Rd
- 2760 Swansea Ct
- 5439 Baybrook Cir
- 5441 Baybrook Cir
- 5443 Baybrook Cir
- 2879 Windsor Forrest Ct
- 2877 Windsor Forrest Ct
- 2875 Windsor Forrest Ct
- 2883 Windsor Forrest Ct
- 2873 Windsor Forrest Ct
- 2871 Windsor Forrest Ct
- 2936 Windsor Forrest Ct
- 2867 Windsor Forrest Ct
- 2881 Godby Rd
- 2863 Godby Rd
- 2873 Godby Rd
- 2875 Godby Rd Unit 2875
- 2881 Godby Rd Unit n/a
- 2865 Godby Rd
- 2869 Godby Rd
- 2861 Godby Rd
- 2883 Godby Rd
- 2867 Godby Rd
- 2865 Windsor Forrest Ct
- 2847 Windsor Forrest Ct