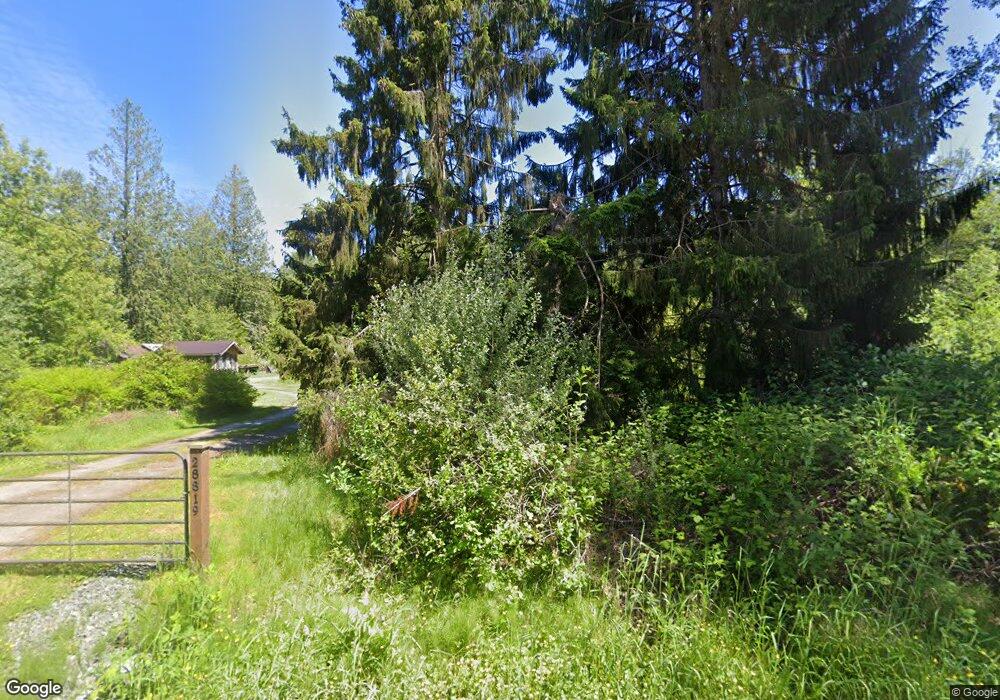
28819 54th Ave NW Stanwood, WA 98292
Estimated Value: $883,000 - $1,113,000
3
Beds
1
Bath
2,098
Sq Ft
$451/Sq Ft
Est. Value
About This Home
This home is located at 28819 54th Ave NW, Stanwood, WA 98292 and is currently estimated at $947,181, approximately $451 per square foot. 28819 54th Ave NW is a home located in Snohomish County with nearby schools including Cedarhome Elementary School, Stanwood Middle School, and Stanwood High School.
Ownership History
Date
Name
Owned For
Owner Type
Purchase Details
Closed on
May 14, 2019
Sold by
Cockrum Russell H and Cockrum Grace M
Bought by
Cockrum Grace M and Cockrum Russell H
Current Estimated Value
Purchase Details
Closed on
Mar 12, 2018
Sold by
Cockrum Grace M
Bought by
Cockrum Russell H and Cockrum Grace M
Purchase Details
Closed on
Feb 22, 2010
Sold by
Standinger Linda G
Bought by
Cockrum Grace M
Home Financials for this Owner
Home Financials are based on the most recent Mortgage that was taken out on this home.
Original Mortgage
$329,000
Outstanding Balance
$217,743
Interest Rate
5.03%
Mortgage Type
Seller Take Back
Estimated Equity
$729,438
Purchase Details
Closed on
Aug 31, 2009
Sold by
Standinger Linda G and Estate Of Michael C Standinger
Bought by
Standinger Linda G
Create a Home Valuation Report for This Property
The Home Valuation Report is an in-depth analysis detailing your home's value as well as a comparison with similar homes in the area
Home Values in the Area
Average Home Value in this Area
Purchase History
| Date | Buyer | Sale Price | Title Company |
|---|---|---|---|
| Cockrum Grace M | -- | None Available | |
| Cockrum Russell H | -- | Ticor Title | |
| Cockrum Grace M | $350,000 | Fidelity National Title Co | |
| Standinger Linda G | -- | Fidelity Natl Title Ins Co |
Source: Public Records
Mortgage History
| Date | Status | Borrower | Loan Amount |
|---|---|---|---|
| Open | Cockrum Grace M | $329,000 |
Source: Public Records
Tax History Compared to Growth
Tax History
| Year | Tax Paid | Tax Assessment Tax Assessment Total Assessment is a certain percentage of the fair market value that is determined by local assessors to be the total taxable value of land and additions on the property. | Land | Improvement |
|---|---|---|---|---|
| 2025 | $5,685 | $798,300 | $494,000 | $304,300 |
| 2024 | $5,685 | $690,300 | $414,000 | $276,300 |
| 2023 | $5,714 | $733,100 | $424,000 | $309,100 |
| 2022 | $5,624 | $583,700 | $334,000 | $249,700 |
| 2020 | $5,290 | $505,400 | $290,000 | $215,400 |
| 2019 | $4,802 | $472,900 | $270,000 | $202,900 |
| 2018 | $4,720 | $429,700 | $240,000 | $189,700 |
| 2017 | $4,038 | $384,400 | $204,000 | $180,400 |
| 2016 | $3,448 | $315,900 | $161,000 | $154,900 |
| 2015 | $3,195 | $280,100 | $154,000 | $126,100 |
| 2013 | $3,098 | $255,200 | $156,000 | $99,200 |
Source: Public Records
Map
Nearby Homes
- 5005 284th St NW
- 28705 48th Ave NW
- 28220 66th Way NW
- 3825 295th Ave NW
- 3811 295th Ave NW
- 29505 40th Ave NW
- 7403 281st St NW
- 7403 281st St NW Unit 63
- 0 52nd Ave NW Unit NWM2321229
- 0 288th St NW Unit NWM2312883
- 6915 284th St NW
- 27902 69th Ave NW
- 28200 70th Ave NW
- 30404 44th Ave NW
- 28500 71st Dr NW
- 27801 71st Ave NW
- The Highland Plan at Patriot Point
- 28100 74th Ave NW Unit 61
- 28100 74th Ave NW
- 7400 281st Place NW Unit 76
- 28926 54th Ave NW
- 28702 54th Ave NW
- 5131 284th St NW
- 28521 54th Ave NW
- 28521 54th Ave NW
- 5421 284th St NW
- 28431 54th Ave NW
- 5623 284th St NW
- 4925 284th St NW
- 4933 284th St NW
- 5123 284th St NW
- 4919 284th St NW
- 5029 284th St NW
- 5725 284th St NW
- 28822 48th Ave NW
- 5707 284th St NW
- 5416 284th St NW
- 28924 48th Ave NW
- 5004 284th St NW