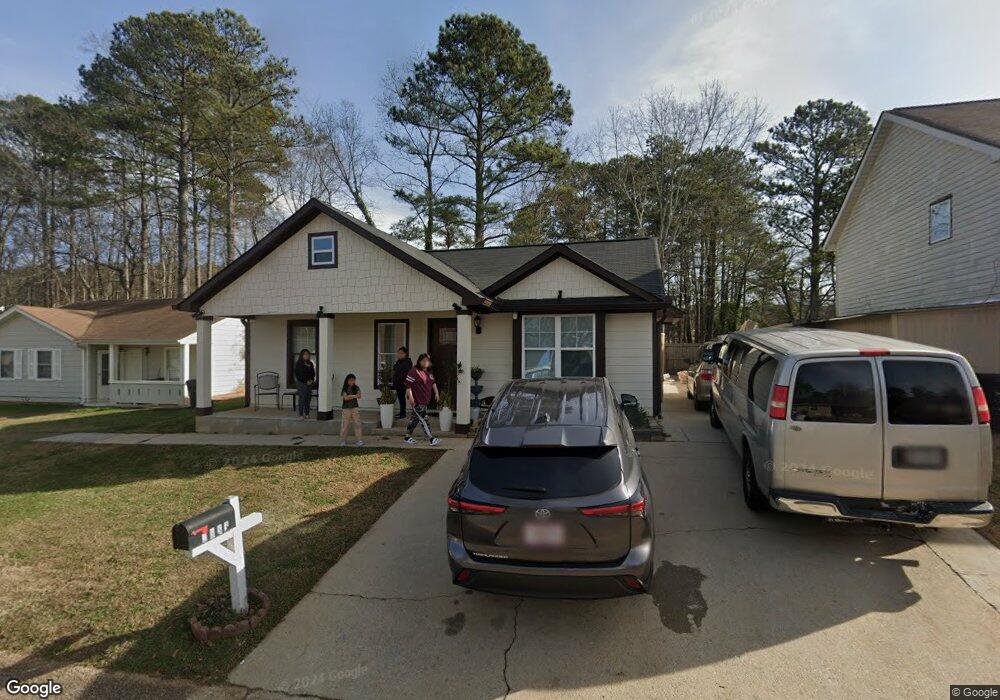
2883 Pebblebrook Dr Buford, GA 30518
Estimated Value: $278,000 - $296,608
2
Beds
1
Bath
1,394
Sq Ft
$206/Sq Ft
Est. Value
About This Home
This home is located at 2883 Pebblebrook Dr, Buford, GA 30518 and is currently estimated at $286,902, approximately $205 per square foot. 2883 Pebblebrook Dr is a home located in Gwinnett County with nearby schools including Buford Elementary School, Buford Senior Academy, and Buford Academy.
Ownership History
Date
Name
Owned For
Owner Type
Purchase Details
Closed on
Jan 29, 2018
Sold by
Arellano Felipe
Bought by
Alaniz Hilaria Arellano
Current Estimated Value
Purchase Details
Closed on
Jun 2, 2009
Sold by
Ex-Officio Sheriff Of Gwinnett
Bought by
Parson Thelma and Martin Marvelle
Purchase Details
Closed on
Sep 18, 2003
Sold by
East-Gresham Judith P
Bought by
Arroyo Idelfonso C
Home Financials for this Owner
Home Financials are based on the most recent Mortgage that was taken out on this home.
Original Mortgage
$77,200
Interest Rate
6.28%
Mortgage Type
New Conventional
Purchase Details
Closed on
Jun 16, 1997
Sold by
Longenecker Mark and Longenecker Tamara
Bought by
East Gresham Judith P
Home Financials for this Owner
Home Financials are based on the most recent Mortgage that was taken out on this home.
Original Mortgage
$59,765
Interest Rate
7.93%
Mortgage Type
FHA
Purchase Details
Closed on
Dec 17, 1996
Sold by
Triangle Propsinc
Bought by
Longenecker Mark Tamara
Create a Home Valuation Report for This Property
The Home Valuation Report is an in-depth analysis detailing your home's value as well as a comparison with similar homes in the area
Home Values in the Area
Average Home Value in this Area
Purchase History
| Date | Buyer | Sale Price | Title Company |
|---|---|---|---|
| Alaniz Hilaria Arellano | -- | -- | |
| Parson Thelma | $622 | -- | |
| Arroyo Idelfonso C | $79,600 | -- | |
| East Gresham Judith P | $61,000 | -- | |
| Longenecker Mark Tamara | $47,000 | -- |
Source: Public Records
Mortgage History
| Date | Status | Borrower | Loan Amount |
|---|---|---|---|
| Previous Owner | Arroyo Idelfonso C | $77,200 | |
| Previous Owner | East Gresham Judith P | $59,765 | |
| Closed | Longenecker Mark Tamara | $0 |
Source: Public Records
Tax History Compared to Growth
Tax History
| Year | Tax Paid | Tax Assessment Tax Assessment Total Assessment is a certain percentage of the fair market value that is determined by local assessors to be the total taxable value of land and additions on the property. | Land | Improvement |
|---|---|---|---|---|
| 2024 | $1,449 | $100,120 | $19,600 | $80,520 |
| 2023 | $1,449 | $100,120 | $19,600 | $80,520 |
| 2022 | $1,142 | $78,760 | $16,000 | $62,760 |
| 2021 | $695 | $47,600 | $8,000 | $39,600 |
| 2020 | $511 | $34,760 | $8,000 | $26,760 |
| 2019 | $409 | $30,600 | $8,000 | $22,600 |
| 2018 | $409 | $30,600 | $8,000 | $22,600 |
| 2016 | $258 | $19,160 | $4,000 | $15,160 |
| 2015 | $247 | $17,720 | $4,000 | $13,720 |
| 2014 | $175 | $12,120 | $3,000 | $9,120 |
Source: Public Records
Map
Nearby Homes
- 2938 Pebblebrook Dr
- 0 Arden Dr Unit 10578909
- 0 Arden Dr Unit 7627968
- 2740 Blake Towers Ln
- 2910 Blake Towers Ln
- 2930 Blake Towers Ln
- 2307 Loughridge Dr
- 4298 Friar Tuck Ln
- 4375 Easter Lily Ave
- 3021 Sea Aster Way
- 3016 Sea Aster Way
- 3273 N Bogan Rd
- 2802 Lakeview Ct
- 3340 Ivey Ridge Rd NE
- 4679 Silver Meadow Dr
- 3271 Meadow Lily Ct
- 4650 Silver Meadow Dr
- 2678 N Bogan Rd
- 2956 Spring Lake Dr
- 2887 Pebblebrook Dr
- 2879 Pebblebrook Dr
- 2891 Pebblebrook Dr
- 2882 Pebblebrook Dr
- 2886 Pebblebrook Dr
- 2878 Pebblebrook Dr
- 2890 Pebblebrook Dr Unit 1
- 2895 Pebblebrook Dr
- 2894 Pebblebrook Dr
- 4585 Radio Park Dr
- 4521 Thompson Mill Rd
- 0 Sundance Ct Unit 3232860
- 0 Sundance Ct
- 4549 Thompson Mill Rd
- 2883 Sundance Ct
- 2887 Sundance Ct
- 2899 Pebblebrook Dr
- 2879 Sundance Ct
- 2891 Sundance Ct
- 2898 Pebblebrook Dr