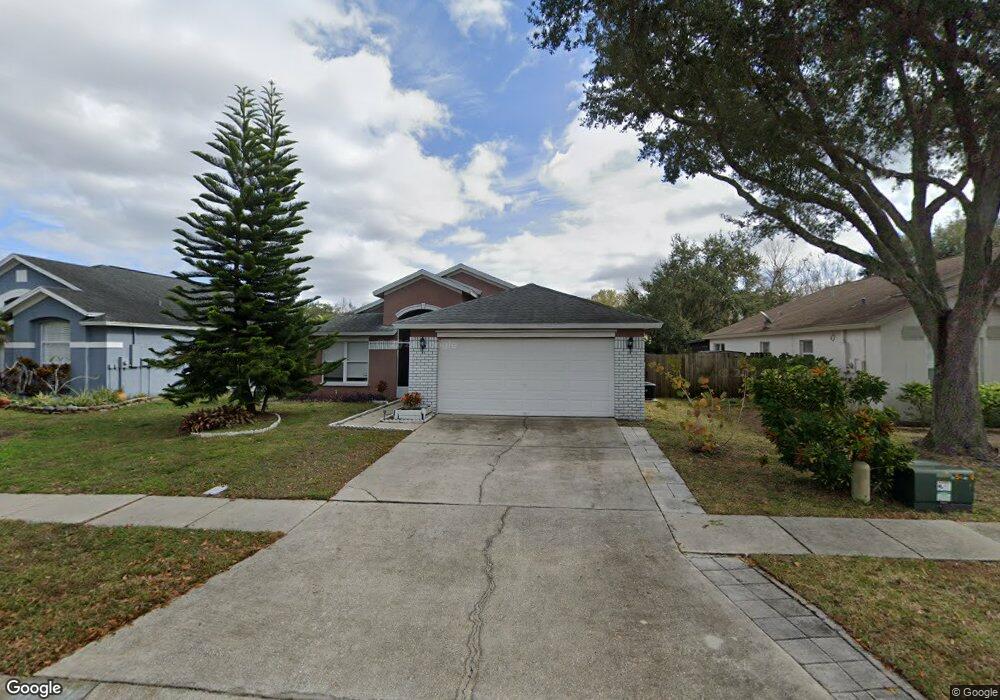
28830 Midnight Star Loop Wesley Chapel, FL 33543
Estimated Value: $345,915 - $382,000
Studio
2
Baths
1,978
Sq Ft
$185/Sq Ft
Est. Value
About This Home
This home is located at 28830 Midnight Star Loop, Wesley Chapel, FL 33543 and is currently estimated at $364,979, approximately $184 per square foot. 28830 Midnight Star Loop is a home located in Pasco County with nearby schools including Sand Pine Elementary School, Dr. John Long Middle School, and Wiregrass Ranch High School.
Ownership History
Date
Name
Owned For
Owner Type
Purchase Details
Closed on
Jul 14, 2015
Sold by
Patane Edward and Patane Angelyna
Bought by
Vespa Asset Management Llc
Current Estimated Value
Purchase Details
Closed on
Dec 26, 2002
Sold by
Hinds Blaine and Hinds Elizabeth
Bought by
Patane Edward A and Patane Angelyna
Home Financials for this Owner
Home Financials are based on the most recent Mortgage that was taken out on this home.
Original Mortgage
$108,000
Interest Rate
5.92%
Mortgage Type
New Conventional
Purchase Details
Closed on
Jun 22, 1998
Sold by
Lieb Eric S and Lieb Kristin
Bought by
Hinds Elizabeth and Hinds Blaine
Home Financials for this Owner
Home Financials are based on the most recent Mortgage that was taken out on this home.
Original Mortgage
$99,750
Interest Rate
7.14%
Mortgage Type
New Conventional
Create a Home Valuation Report for This Property
The Home Valuation Report is an in-depth analysis detailing your home's value as well as a comparison with similar homes in the area
Home Values in the Area
Average Home Value in this Area
Purchase History
| Date | Buyer | Sale Price | Title Company |
|---|---|---|---|
| Vespa Asset Management Llc | -- | None Available | |
| Patane Edward A | $135,000 | -- | |
| Hinds Elizabeth | $105,000 | -- |
Source: Public Records
Mortgage History
| Date | Status | Borrower | Loan Amount |
|---|---|---|---|
| Previous Owner | Hinds Elizabeth | $108,000 | |
| Previous Owner | Hinds Elizabeth | $99,750 |
Source: Public Records
Tax History
| Year | Tax Paid | Tax Assessment Tax Assessment Total Assessment is a certain percentage of the fair market value that is determined by local assessors to be the total taxable value of land and additions on the property. | Land | Improvement |
|---|---|---|---|---|
| 2026 | $6,385 | $334,517 | $74,052 | $260,465 |
| 2025 | $6,385 | $334,517 | $74,052 | $260,465 |
| 2024 | $6,385 | $349,431 | $74,052 | $275,379 |
| 2023 | $6,096 | $265,400 | $0 | $0 |
| 2022 | $5,148 | $295,897 | $56,482 | $239,415 |
| 2021 | $4,289 | $219,349 | $50,671 | $168,678 |
| 2020 | $4,029 | $203,317 | $27,540 | $175,777 |
| 2019 | $4,026 | $202,297 | $27,540 | $174,757 |
| 2018 | $3,750 | $186,301 | $27,540 | $158,761 |
| 2017 | $3,511 | $165,949 | $27,540 | $138,409 |
| 2016 | $3,363 | $157,195 | $27,540 | $129,655 |
| 2015 | $3,283 | $149,256 | $27,540 | $121,716 |
| 2014 | $3,031 | $137,389 | $29,150 | $108,239 |
Source: Public Records
Map
Nearby Homes
- 28724 Hanging Moss Loop
- 9417 Leatherwood Ave
- 9446 Leatherwood Ave
- 28516 Hanging Moss Loop
- 9450 Leatherwood Ave
- 1334 Scattered Pines Place
- 28438 Tall Grass Dr
- 1342 Colt Creek Place
- 20703 Great Laurel Ave
- 28647 Twinbrook Ln
- 29529 Crossland Dr
- 20326 Merry Oak Ave
- 28244 Brokenmead Path
- 20626 Longleaf Pine Ave
- 1941 Tampa Bay Dr
- 20520 Sultana Ct
- 29619 Allegro Dr Unit 2
- 28390 Openfield Loop
- 1946 Tarpon Ct
- 20420 Carolina Cherry Ct
- 28834 Midnight Star Loop
- 28826 Midnight Star Loop
- 1309 Timber Trace Dr
- 28838 Midnight Star Loop Unit 3
- 28822 Midnight Star Loop
- 1311 Timber Trace Dr
- 1307 Timber Trace Dr
- 28831 Midnight Star Loop
- 1315 Timber Trace Dr
- 28839 Midnight Star Loop
- 28817 Midnight Star Loop
- 28818 Loop
- 1317 Timber Trace Dr
- 28842 Midnight Star Loop
- 1305 Timber Trace Dr
- 28845 Midnight Star Loop
- 28814 Midnight Star Loop
- 28846 Midnight Star Loop
- 1319 Timber Trace Dr Unit 1
- 28805 Midnight Star Loop
Your Personal Tour Guide
Ask me questions while you tour the home.