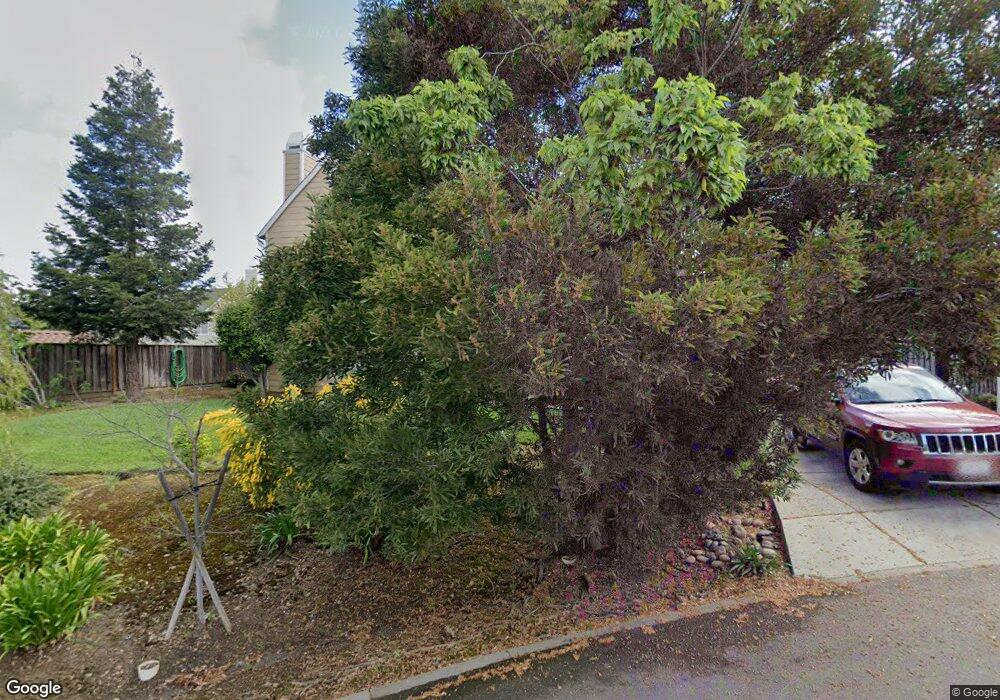
2884 Rutherford Ct Livermore, CA 94550
The Vineyards NeighborhoodEstimated Value: $2,045,000 - $2,334,000
About This Home
This home is located at 2884 Rutherford Ct, Livermore, CA 94550 and is currently estimated at $2,252,294, approximately $561 per square foot. 2884 Rutherford Ct is a home located in Alameda County with nearby schools including Arroyo Seco Elementary School, East Avenue Middle School, and Livermore High School.
Ownership History
We collect this data history from publicly available records. To have your information removed, we recommend requesting removal directly through your county’s website.
Purchase Details
Purchase Details
Home Financials for this Owner
Home Financials are based on the most recent Mortgage that was taken out on this home.Purchase Details
Home Financials for this Owner
Home Financials are based on the most recent Mortgage that was taken out on this home.Purchase Details
Home Financials for this Owner
Home Financials are based on the most recent Mortgage that was taken out on this home.Home Values in the Area
Average Home Value in this Area
Purchase History
We collect this data history from publicly available records. To have your information removed, we recommend requesting removal directly through your county’s website.
| Date | Buyer | Sale Price | Title Company |
|---|---|---|---|
| -- | None Listed On Document | ||
| $1,552,000 | Wfg National Title Ins Co | ||
| $1,080,000 | Wfg National Title Ins Co | ||
| $1,220,500 | First American Title |
Mortgage History
We collect this data history from publicly available records. To have your information removed, we recommend requesting removal directly through your county’s website.
| Date | Status | Borrower | Loan Amount |
|---|---|---|---|
| Previous Owner | $950,000 | ||
| Previous Owner | $750,000 | ||
| Previous Owner | $854,301 |
Tax History
We collect this data history from publicly available records. To have your information removed, we recommend requesting removal directly through your county’s website.
| Year | Tax Paid | Tax Assessment Tax Assessment Total Assessment is a certain percentage of the fair market value that is determined by local assessors to be the total taxable value of land and additions on the property. | Land | Improvement |
|---|---|---|---|---|
| 2025 | $21,321 | $1,672,807 | $503,866 | $1,175,941 |
| 2024 | $21,321 | $1,639,875 | $493,988 | $1,152,887 |
| 2023 | $21,016 | $1,614,596 | $484,306 | $1,130,290 |
| 2022 | $20,684 | $1,575,938 | $474,810 | $1,108,128 |
| 2021 | $19,664 | $1,544,900 | $465,500 | $1,086,400 |
| 2020 | $18,373 | $1,425,000 | $500,000 | $925,000 |
| 2019 | $18,773 | $1,425,000 | $427,500 | $997,500 |
| 2018 | $17,432 | $1,320,000 | $396,000 | $924,000 |
| 2017 | $16,880 | $1,300,000 | $390,000 | $910,000 |
| 2016 | $15,819 | $1,230,000 | $369,000 | $861,000 |
| 2015 | $13,767 | $1,110,000 | $333,000 | $777,000 |
| 2014 | $12,138 | $960,000 | $288,000 | $672,000 |
Map
- 2785 Decker Ln
- 6741 Tesla Rd
- 5329 Flagg Ln
- 5143 Tesla Rd
- 1635 Embassy Cir
- 4224 Greenville Rd
- 5218 Norma Way
- 5538 Charlotte Way
- 5354 Sandra Way
- 1504 Melanie Way
- 5996 Melanie Ct
- 5451 Delia Way
- 1045 Hollice Ln
- 838 Hazel St
- 1972 S Livermore Ave
- 1317 Saint Mary Dr
- 679 Jeannie Way
- 4115 Freeda Ct
- 4028 Drake Way
- 4671 Laurie Common Unit 101
- 0 Rutherford Ct
- 6119 Bella Oaks Ct
- 6127 Bella Oaks Ct
- 6155 Bella Oaks Ct
- 2877 Rutherford Ct
- 2865 Rutherford Ct
- 2889 Rutherford Ct
- 2853 Rutherford Ct
- 2891 Rutherford Ct
- 6102 Bella Oaks Ct
- 6134 Bella Oaks Ct
- 6168 Bella Oaks Ct
- 2831 Rutherford Ct
- 6176 Bella Oaks Ct
- 2810 Rutherford Ct
- 2817 Rutherford Ct
- 6180 Bella Oaks Ct
- 2806 Rutherford Ct
- 2700 S Vasco Rd
- 2803 Rutherford Ct
Ask me questions while you tour the home.